Copyright
©2006 Baishideng Publishing Group Co.
World J Gastroenterol. Oct 28, 2006; 12(40): 6446-6452
Published online Oct 28, 2006. doi: 10.3748/wjg.v12.i40.6446
Published online Oct 28, 2006. doi: 10.3748/wjg.v12.i40.6446
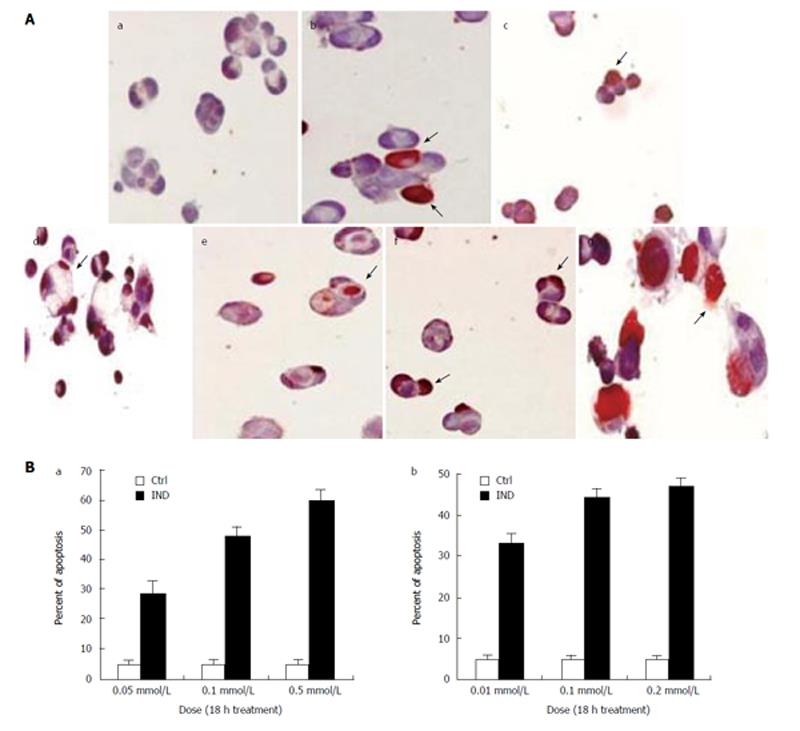
Figure 1 A: TUNEL staining of Caco-2 cells.
IND and NS treatment cause apoptosis in a dose dependent manner after 18 h. (a) Control; (b) IND 0.05 mmol/L; (c) IND 0.1 mmol/L; (d) IND 0.5 mmol/L; (e) NS 0.01 mmol/L; (f) NS 0.1 mmol/L; (g) NS 0.2 mmol/L. Experiments performed in triplicates; B: Apoptosis in Caco-2 cells is dose dependent after treatment with (a) IND and (b) NS for 18 h. Experiments performed in triplicates.
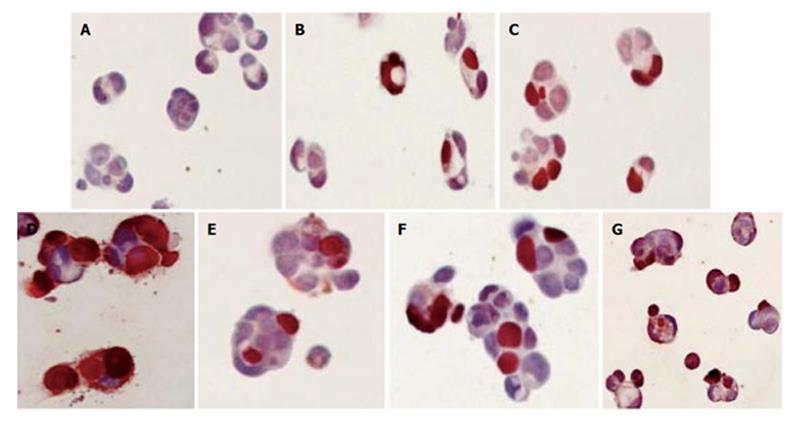
Figure 2 TUNEL staining of Caco-2 cells treated with IND (0.
1 mmol/L) and NS (0.1 mmol/L) for 1, 5 and 18 h. (A) Control; (B) IND for 1 h; (C) IND for 5 h; (D) IND for 18 h; (E) NS for 1 h; (F) NS for 5 h; (G) NS for 18 h.
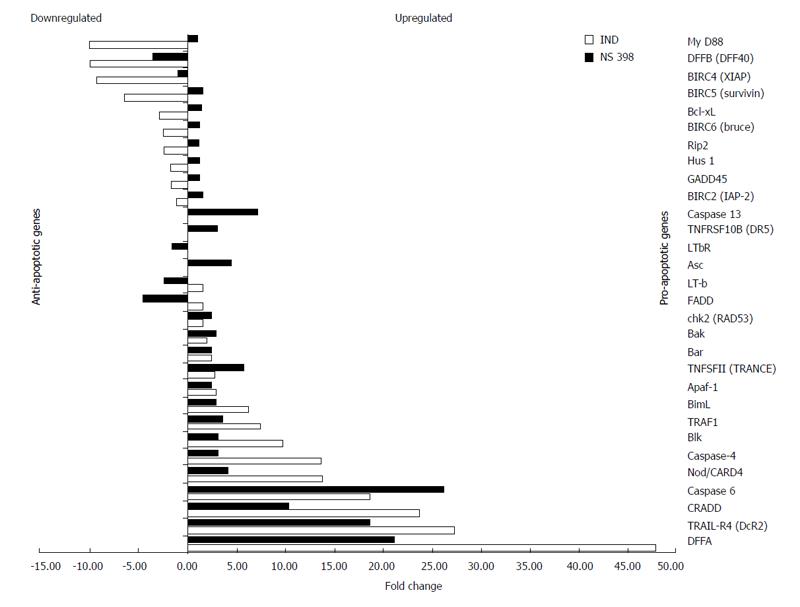
Figure 3 Genes up-regulated and down-regulated by IND and NS treatment identified by cDNA microarray.
Up-regulation or down-regulation is expressed as a fold change. Down-regulated genes are shown on the top of the graph in a decreasing order toward mid graph, while up-regulated genes in an increasing order toward the bottom of the graph. Anti-apoptotic genes lie mostly in the upper half while pro-apoptotic genes lie mainly in the bottom half.
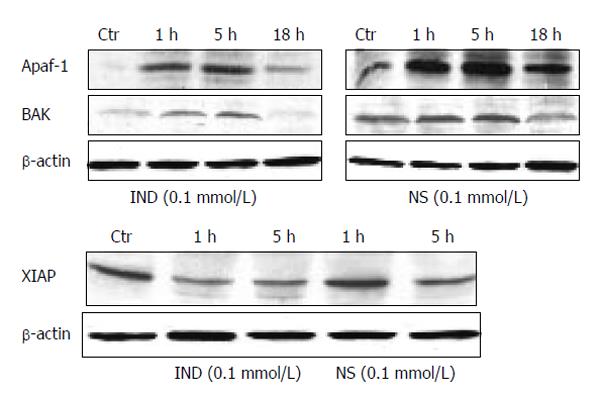
Figure 4 Protein expression by Western blotting of pro-apoptotic genes Apaf-1 and Bak (upper panel), expression of XIAP (lower panel).
Blots are representative of triplicate experiments.
- Citation: Huang RH, Chai J, Tarnawski AS. Identification of specific genes and pathways involved in NSAIDs-induced apoptosis of human colon cancer cells. World J Gastroenterol 2006; 12(40): 6446-6452
- URL: https://www.wjgnet.com/1007-9327/full/v12/i40/6446.htm
- DOI: https://dx.doi.org/10.3748/wjg.v12.i40.6446


