Copyright
©2006 Baishideng Publishing Group Co.
World J Gastroenterol. Jan 28, 2006; 12(4): 659-661
Published online Jan 28, 2006. doi: 10.3748/wjg.v12.i4.659
Published online Jan 28, 2006. doi: 10.3748/wjg.v12.i4.659
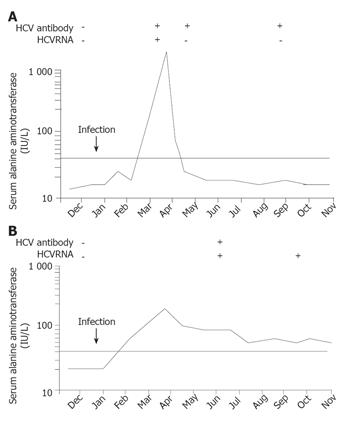
Figure 1 Clinical, biochemical, and serologic profile of patients.
A: patient 1; B: patient 2. HCV antibodies were detected by third-generation tests and HCV RNA was detected in serum by reverse-transcription PCR. Alanine aminotransferase values are shown on a logarithmic scale, and the horizontal lines indicate the upper limit of the normal range.
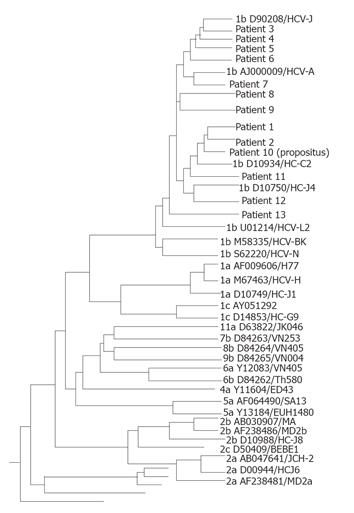
Figure 2 Phylogenetic tree analysis comparing coding sequences in the HCV regions for the envelope glycoproteins E1.
For phylogenetic tree analysis, 13 sequences obtained from the 13 patients involved in this study were compared with 33 sequences taken as unrelated controls (genotype and GenBank accession numbers are indicated).
- Citation: Kakizaki S, Takagi H, Yamazaki Y, Sohara N, Sato K, Nagamine T, Mori M. Different outcomes of nosocomial infection with hepatitis C virus from the same origin. World J Gastroenterol 2006; 12(4): 659-661
- URL: https://www.wjgnet.com/1007-9327/full/v12/i4/659.htm
- DOI: https://dx.doi.org/10.3748/wjg.v12.i4.659


