Copyright
©2006 Baishideng Publishing Group Co.
World J Gastroenterol. Oct 21, 2006; 12(39): 6355-6360
Published online Oct 21, 2006. doi: 10.3748/wjg.v12.i39.6355
Published online Oct 21, 2006. doi: 10.3748/wjg.v12.i39.6355
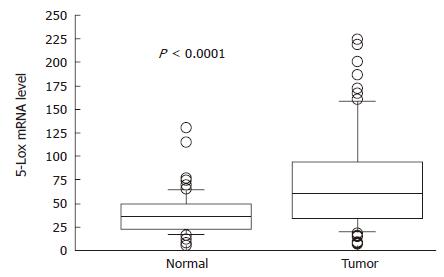
Figure 1 Differential 5-Lox mRNA relative quantity between matched normal mucosa and tumor tissue samples.
Boxes: lower and upper quartiles (median inside); bars: at end of whiskers; individual plots: values outside the range of the whiskers.
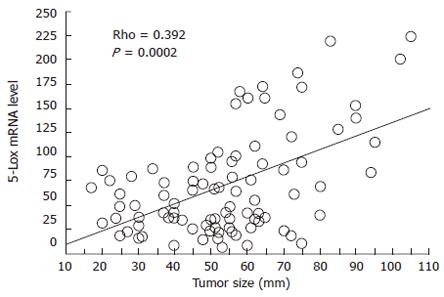
Figure 2 Linear regression plot showing a significant positive correlation between tumoral 5-Lox mRNA level and tumor size.
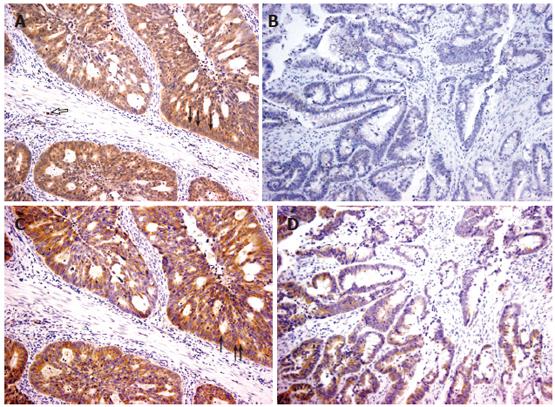
Figure 3 Representative cases of 5-Lox/Cox-2 immunostaining in colorectal cancer (x 200).
A: Positive, diffuse, strong cytoplasmic and focal nuclear membrane 5-Lox staining in epithelial tumor cells (black arrow) and stromal cells (white arrow); B: Negative, weak 5-Lox staining. The same samples are shown with strong (C) and moderate (D) Cox-2 staining.
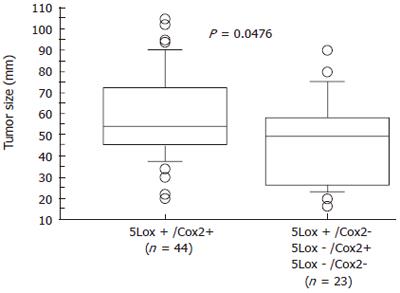
Figure 4 Differential tumor size between a group of concurrent 5-Lox/Cox-2 positive samples and a group of others (5Lox+/Cox2-; 5Lox-/Cox2+; 5Lox-/Cox2-).
- Citation: Soumaoro LT, Iida S, Uetake H, Ishiguro M, Takagi Y, Higuchi T, Yasuno M, Enomoto M, Sugihara K. Expression of 5-Lipoxygenase in human colorectal cancer. World J Gastroenterol 2006; 12(39): 6355-6360
- URL: https://www.wjgnet.com/1007-9327/full/v12/i39/6355.htm
- DOI: https://dx.doi.org/10.3748/wjg.v12.i39.6355


