Copyright
©2006 Baishideng Publishing Group Co.
World J Gastroenterol. Oct 21, 2006; 12(39): 6316-6324
Published online Oct 21, 2006. doi: 10.3748/wjg.v12.i39.6316
Published online Oct 21, 2006. doi: 10.3748/wjg.v12.i39.6316
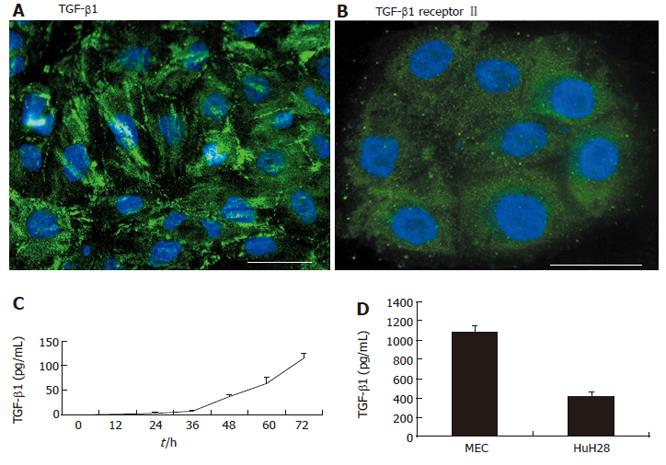
Figure 1 Expression of TGF-β1 and TGF-β receptor II in intrahepatic cholangiocarcinoma cell lines.
Immunofluorescence showed staining of TGF-β1 (A) and TGF-β receptor II (B) in HuCCT1 cells. Scale bar = 20 μm. C: Detection of TGF-β1 in supernatant of HuCCT1 by ELISA. TGF-β1 levels in the supernatant of HuCCT1 showed a time-dependent increase; D: The other ICC cell lines were incubated for 48 h and assayed by ELISA to determine the levels of TGF-β1 in the supernatants. MEC and HuH-28 cells also secreted TGF-β1 into the supernatants.
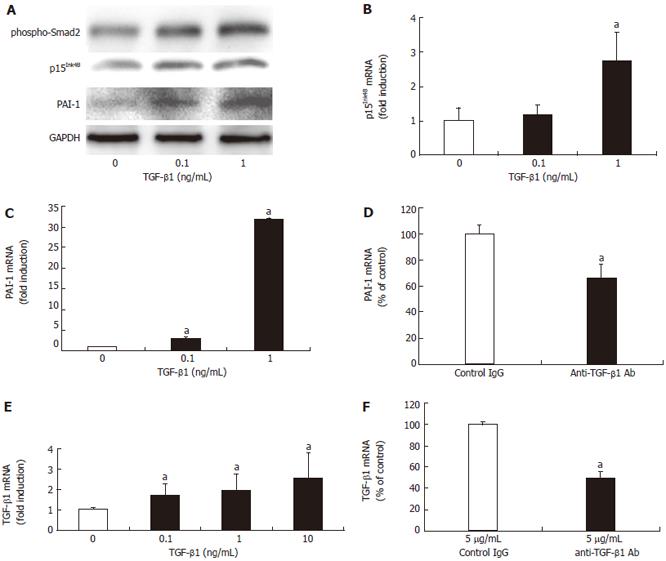
Figure 2 TGF-β1 stimulates the TGF-β signaling pathway.
A: The addition of 0.1 and 1 ng/mL TGF-β1 augmented Smad2 phosphorylation (phospho-Smad2), p15Ink4B, and PAI-1 proteins in Western blotting of HuCCT1 cells; B: TGF-β1 stimulation for 48 h enhanced p15Ink4B mRNA expression in HuCCT1 cells in RT-PCR: aP < 0.05 vs absence of TGF-β1; C: TGF-β1 stimulation for 48 h also augmented PAI-1 mRNA expression in HuCCT1 cells in RT-PCR: aP < 0.05 vs absence of TGF-β1; D: PAI-1 mRNA was determined by RT-PCR after incubating the HuCCT1 cells with 5 ng/mL neutralizing anti-TGF-β1 antibody or nonimmune control IgG for 96 h. The addition of anti-TGF-β1 antibody attenuated the level of PAI-1 mRNA: aP < 0.05 vs control IgG; E: The addition of TGF-β1 to HuCCT1 for 6 h led to a concentration-dependent increase in TGF-β1 mRNA expression by RT-PCR: aP < 0.05 vs absence of TGF-β1; F: TGF-β1 mRNA in HuCCT1 was determined by RT-PCR after incubating the cells with 5 ng/mL neutralizing anti-TGF-β1 antibody or nonimmune control IgG for 96 h. The addition of anti-TGF-β1 antibody attenuated the level of TGF-β1 mRNA: aP < 0.05 vs control IgG.
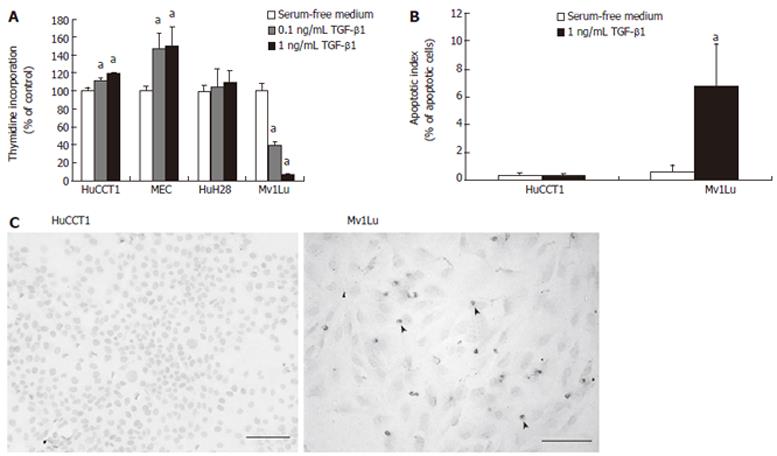
Figure 3 Effect of TGF-β1 on the cell growth and apoptosis of ICC cell lines.
A: The cells were subjected to a 3H-thymidine incorporation assay in the absence or presence of TGF-β1. No mitoinhibitory effect of TGF-β1 was observed in the ICC cells. TGF-β1 stimulation augmented the DNA synthesis of TGF-β1 in the HuCCT1 and MEC cells. In contrast, TGF-β1 treatment elicited a strong mitoinhibitory effect in Mv1Lu; B: Stimulation with 1 ng/mL TGF-β1 for 48 h did not induce apoptosis of HuCCT1 cells in a TUNEL assay. In the experiment using Mv1Lu, however, stimulation with TGF-β1 at the same concentration for the same duration did elicit an apoptotic effect: aP < 0.05 vs absence of TGF-β1; C: HuCCT1 and Mv1Lu cells were treated with 1 ng/mL TGF-β1 for 48 h. The arrows denote apoptotic cells identified by the TUNEL method. Scale bar = 100 μm.
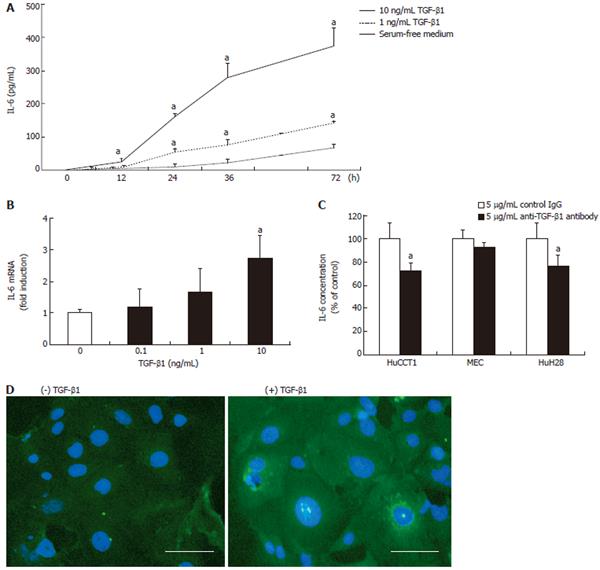
Figure 4 Effect of TGF-β1 on the IL-6 expression of ICC cells.
A: ELISA revealed the secretion of IL-6 by HuCCT1 into the serum-free medium. HuCCT1 also showed a time-dependent increase of IL-6 concentrations in response to 1 and 10 ng/mL TGF-β1 stimulation: aP < 0.05 vs absence of TGF-β1; B: The addition of TGF-β1 to HuCCT1 for 6 h resulted in a dose-dependent increase of IL-6 mRNA expression by RT-PCR: aP < 0.05 vs absence of TGF-β1; C: IL-6 levels in the supernatants were determined by ELISA after incubating ICC cells with 5 ng/mL neutralizing anti-TGF-β1 antibody or nonimmune control IgG for 96 h. The addition of neutralizing anti-TGF-β1 antibody resulted in a decrease of IL-6 production in HuCCT1 and HuH28: aP < 0.05 vs control IgG; D: An immunofluorescence study using HuCCT1 cells demonstrated an increase in IL-6 production in response to TGF-β1. Immunoreactivity with a specific anti-IL6 antibody was weak, with no stimulation of TGF-β1, whereas 10 ng/mL TGF-β1 induced IL-6 expression in the cytoplasm of the HuCCT1 cells. Scale bar = 20 μm.
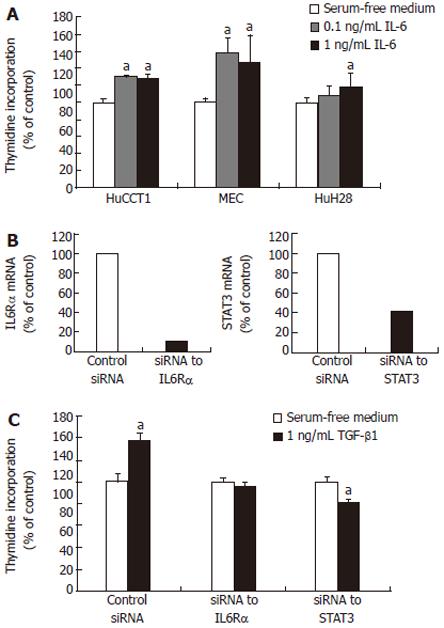
Figure 5 Effects of TGF-β1 on DNA synthesis during inhibition of IL-6 functions.
A: All of the ICC cells demonstrated enhanced DNA synthesis in response to IL-6: aP < 0.05 vs absence of IL-6. We next investigated whether TGF-β1 promoted ICC cell growth during the inhibition of IL-6 functions by small interfering RNA (siRNA); B: RT-PCR was conducted to assess the effects of siRNA in suppressing the mRNA expressions of IL-6Rα and STAT3. IL-6Rα and STAT3 mRNA expression was suppressed by 10.6% and 41.9%, relative to control siRNA; C: The silencing of IL-6Rα and STAT3 mRNA expressions by siRNA in HuCCT1 cells led to a suppression in the TGF-β1-induced DNA synthesis relative to that observed under the control siRNA condition: aP < 0.05 vs absence of rhTGF-β1.
- Citation: Shimizu T, Yokomuro S, Mizuguchi Y, Kawahigashi Y, Arima Y, Taniai N, Mamada Y, Yoshida H, Akimaru K, Tajiri T. Effect of transforming growth factor-β1 on human intrahepatic cholangiocarcinoma cell growth. World J Gastroenterol 2006; 12(39): 6316-6324
- URL: https://www.wjgnet.com/1007-9327/full/v12/i39/6316.htm
- DOI: https://dx.doi.org/10.3748/wjg.v12.i39.6316


