Copyright
©2006 Baishideng Publishing Group Co.
World J Gastroenterol. Oct 21, 2006; 12(39): 6285-6289
Published online Oct 21, 2006. doi: 10.3748/wjg.v12.i39.6285
Published online Oct 21, 2006. doi: 10.3748/wjg.v12.i39.6285
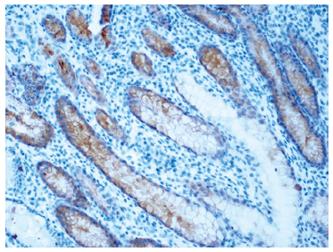
Figure 1 IGFBP2 expression showing a weak pancytoplasmatic staining in normal gastric mucosa (× 200).
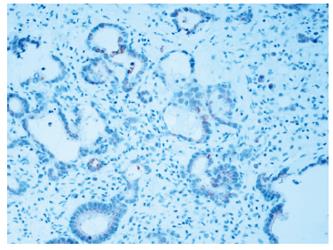
Figure 2 IGFBP2 expression showing a weak cytoplasmatic staining in the tumor cells (× 200).
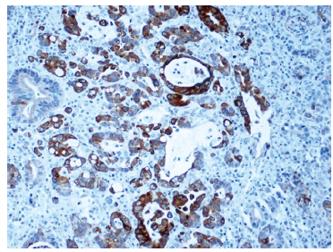
Figure 3 IGFBP2 expression showing a more diffuse granular cytoplasmatic staining in the tumor cells (× 200).
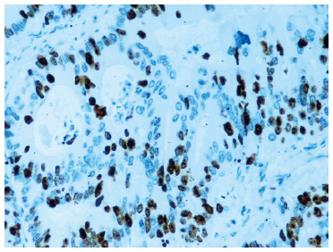
Figure 4 Ki-67 expression showing a strong nuclear staining in the tumor cells (×200).
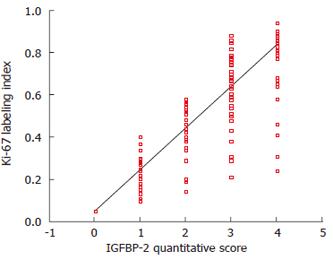
Figure 5 The positive correlation between IGFBP2 expression and Ki-67 in gastric cancer (Spearman's correlation coefficient, P = 0.
005).
- Citation: Shi LH, Zhu XQ, Zhao GH, Xia YB, Zhang YS. Expression of insulin-like growth factor binding protein-2 in gastric carcinoma and its relationship with cell proliferation. World J Gastroenterol 2006; 12(39): 6285-6289
- URL: https://www.wjgnet.com/1007-9327/full/v12/i39/6285.htm
- DOI: https://dx.doi.org/10.3748/wjg.v12.i39.6285


