Copyright
©2006 Baishideng Publishing Group Co.
World J Gastroenterol. Oct 21, 2006; 12(39): 6266-6273
Published online Oct 21, 2006. doi: 10.3748/wjg.v12.i39.6266
Published online Oct 21, 2006. doi: 10.3748/wjg.v12.i39.6266
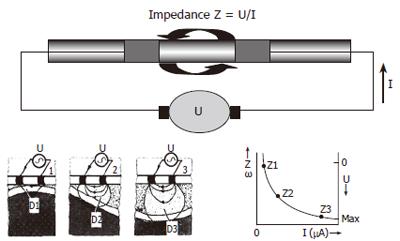
Figure 1 Upper panel: Principles of intraluminal impedancometry: the electrical impedance (Z) of a electric field between 2 electrodes is the ratio between applied voltage (U) and resulting current (I).
Lower panel: Impedance is non-linearly inversely dependent on bolus diameter and electrical conductivity of luminal content.
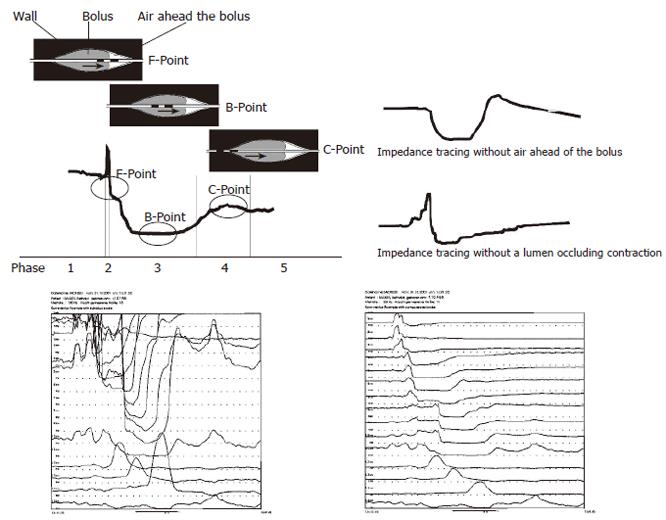
Figure 2 Upper panel: Characteristics of the impedance tracing during bolus passage in the esophagus of healthy persons.
The black electrodes indicate a measuring segment. From baseline, the initial sudden impedance increase represents the arrival of ingested air ahead of the bolus. During the rapid impedance fall due to the arrival of the bolus, the bolus head (F-Point) can be determined as the return of impedance closely to baseline. The bolus passage is represented by a further decrease of impedance followed by a plateau phase. During the plateau phase (phase 3) the bolus is located within the measuring segment. The minimum impedance value during this phase is related to the maximum bolus volume located within the segment, which represents the bolus body (B-Point). Subsequently impedance increases due to wall contraction and the bolus is leaving the segment. The maximum value during impedance increase back to baseline is associated with the moment of lumen occlusion (C-Point). Dependent on bolus volumen and bolus viscosity the exact position of the points of interest is variable as indicated by the oval circle. The impedance tracing may be variable as shown at the right side without air ahead of the bolus or without a rapid lumen occluding contraction. Lower panel: For visuallisation of the minimum and maximum impedance an individual scaling (left side) can be used instead of a normal scaling (right side).
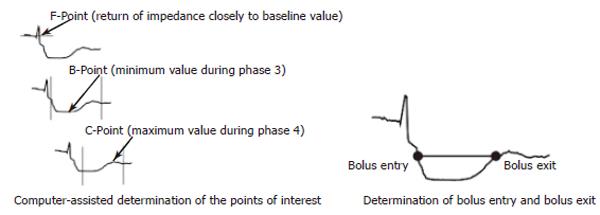
Figure 3 Upper panel: computer assisted determination of the points of interest according to presumed definitions as suggested by Nguyen et al[24,27,29].
Lower panel: bolus entry and bolus exit can be considered to be 50% of the basal impedance as compared to nadir impedance as suggested by Tutuian et al[32,33,34].
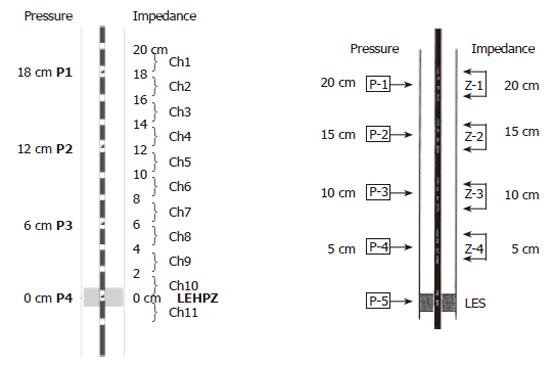
Figure 4 The 2 recently available systems of combined impedance manometry.
During esophageal motility testing the most distaly located pressure transducer was positioned at the lower esophageal high pressure zone. Left panel: 15 channel catheter for combined impedance-manometry procedure. The 4 semiconductor solid-state pressure transducers (P1-P4) serve also as impedance electrodes and are placed at 6 cm distance each. There are 11 impedance segments, each 2 cm long (Ch1-Ch11) with a cascade configuration. The solid-state pressure transducers (P1-P4) are located exactly between the impedance channels 1-2, 4-5, 7-8 and 10-11, respectively. Right panel: 9-channel esophageal function testing catheter with five pressure sensors and four impedance-measuring segment. The impedance measuring-segments consist of pairs of metal rings placed 2 cm apart, centered at 10, 15, 20 and 25 cm from the tip (Z1-Z4). Four of five the pressure sensors are located within the impedance segments (P1-P4). The 5th pressure sensors (P5) is located 5 cm from the tip.
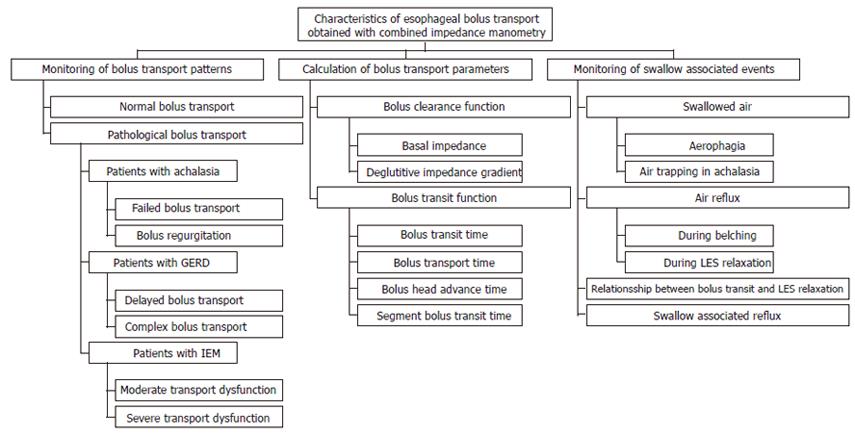
Figure 5 Characteristics of bolus transport as obtained by combined impedance manometry.
Figure 6 Bolus transport patterns as obtained by combined impedance manometry normal pattern (left panel), delayed bolus transport (middle panel) in some patients with GERD, failed transport (right panel) in patients with achalasia.
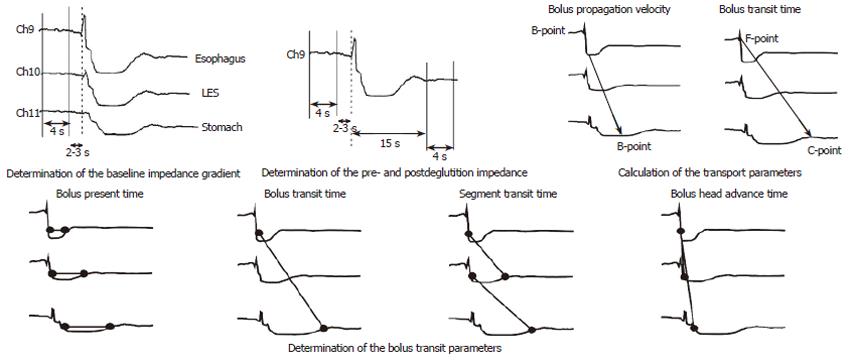
Figure 7 Bolus transport parameters, which can be obtained by combined impedance manometry according to presume definitions of the points of interest.
Figure 8 Swallow associated events as obtained by combined impedance manometry areophagia (left panel), swallow induced reflux (middle pannel), relaxationship between bolus transit and LES-Relaxation (right panel).
- Citation: Nguyen HN, Domingues GRS, Lammert F. Technological insights: Combined impedance manometry for esophageal motility testing-current results and further implications. World J Gastroenterol 2006; 12(39): 6266-6273
- URL: https://www.wjgnet.com/1007-9327/full/v12/i39/6266.htm
- DOI: https://dx.doi.org/10.3748/wjg.v12.i39.6266


