Copyright
©2006 Baishideng Publishing Group Co.
World J Gastroenterol. Oct 14, 2006; 12(38): 6142-6148
Published online Oct 14, 2006. doi: 10.3748/wjg.v12.i38.6142
Published online Oct 14, 2006. doi: 10.3748/wjg.v12.i38.6142
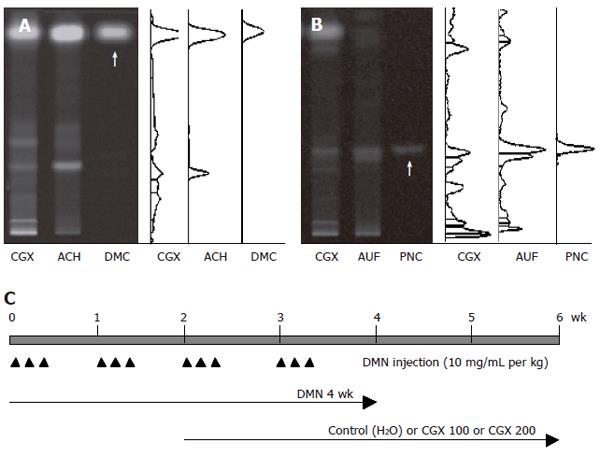
Figure 1 HPTLC-based fingerprint for CGX and scheme for the experiment.
HPTLC analysis was performed to characterize CGX and its two major components (extracts from Artemisia capillaris Herba and Aurantii Fructus) with reference components, 6,7-dimethoxycoumarin and Poncirin. A: 2 μL of CGX (200 mg/mL) and 1 μL of the extract from Artemisia capillaris Herba (50 mg/mL) were subjected to HPTLC with 1 μL of 6, 7-dimethoxycoumarin (0.1 mg/mL); B: 2 μL of CGX (200 mg/mL) and 1 μL of the extract from Aurantii Fructus (50 mg/mL) were subjected to HPTLC with 1 μL of Poncirin (5 mg/mL). Arrows indicate 6,7-dimethoxycoumarin and Poncirin, respectively; C: Simplified scheme summarizing the experimental design: DMN treatment (ip, 3 consecutive days per week, 10 mg/mL per kg for 4 wk) and CGX administration (po, 100 or 200 mg/mL per kg, for 4 wk from 2 wk after DMN treatment). ACH: Artemisia capillaris Herba; AUF: Aurantii Fructus; DMC: 6,7-dimethoxycoumarin; PNC: Poncirin.
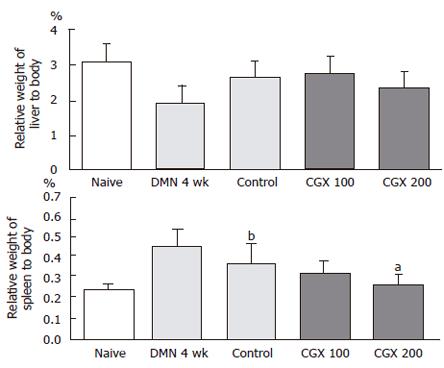
Figure 2 Weight of the liver and spleen relative to total body weight.
Eight male Wistar rats per group were treated with DMN together with or without CGX as described in Figure 1C. At the end of the total treatment period, the liver and the spleen were removed from the rats and the relative organ weight with respect to total body weight was examined. aP < 0.05 vs control group; bP < 0.01 vs naive group.
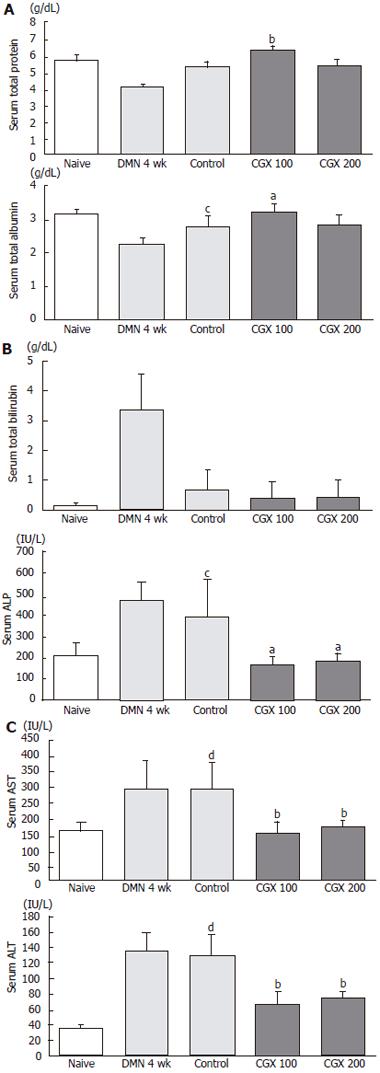
Figure 3 Serum biochemical analyses.
At the end of the total treatment period, sera were prepared from blood collected via abdominal aorta of ether-anesthetized rats to measure (A) total protein and albumin, (B) total bilirubin and ALP, and (C) AST and ALT. aP < 0.05, bP < 0.01 vs control group; cP < 0.05, dP < 0.01 vs naive group.
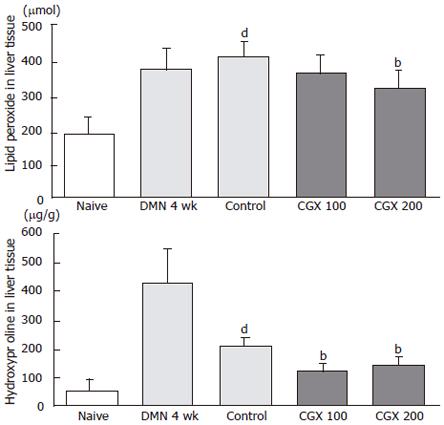
Figure 4 Measurement of lipid peroxide and hydroxyproline levels in liver tissues.
Eight male Wistar rats per group were treated with DMN together with or without CGX as described in Figure 1C. At the end of the total treatment period, malondialdehyde and hydroxyproline were determined in the liver tissues. bP < 0.01 vs control group; dP < 0.01 vs naive group.
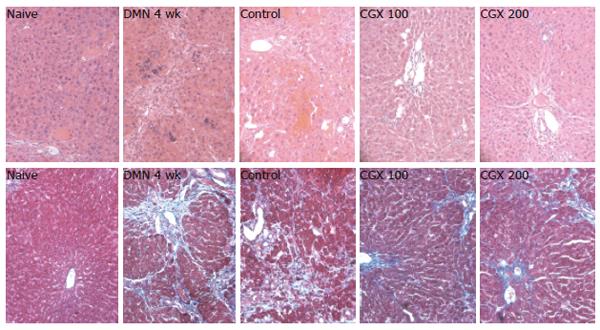
Figure 5 Histopathologic examination of liver tissues.
Eight male Wistar rats per group were treated with DMN together with or without CGX as described in Figure 1C. At the end of the total treatment period, the liver was removed, fixed in Bouin's solution, and stained with hematoxylin and eosin (top, x 200 magnification) or Masson's trichome (bottom, x 200 magnification) for histological examination under a light microscope.
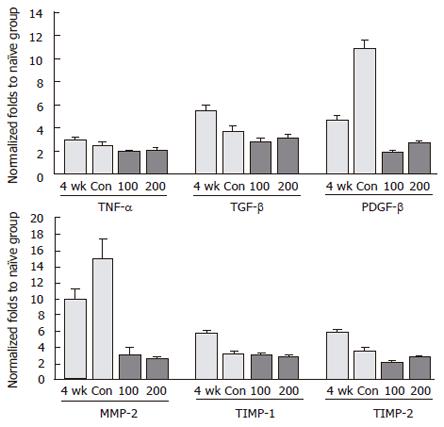
Figure 6 Expression of fibrosis-related genes using real-time PCR.
Eight male Wistar rats per group were treated with DMN together with or without CGX as described in Figure 1C. At the end of the total treatment period, total RNA was prepared from liver tissues and used for cDNA synthesis. Quantitative real-time PCR was then performed using SYBR green supermix reagent with the gene-specific primers. The results are expressed in terms of fold increase in the expression levels relative to the naive control group. Con: Control.
- Citation: Shin JW, Son JY, Oh SM, Han SH, Wang JH, Cho JH, Cho CK, Yoo HS, Lee YW, Lee MM, Hu XP, Son CG. An herbal formula, CGX, exerts hepatotherapeutic effects on dimethylnitrosamine-induced chronic liver injury model in rats. World J Gastroenterol 2006; 12(38): 6142-6148
- URL: https://www.wjgnet.com/1007-9327/full/v12/i38/6142.htm
- DOI: https://dx.doi.org/10.3748/wjg.v12.i38.6142


