Copyright
©2006 Baishideng Publishing Group Co.
World J Gastroenterol. Sep 28, 2006; 12(36): 5875-5877
Published online Sep 28, 2006. doi: 10.3748/wjg.v12.i36.5875
Published online Sep 28, 2006. doi: 10.3748/wjg.v12.i36.5875
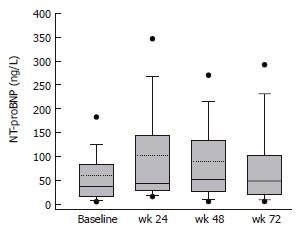
Figure 1 Plasma NT-proBNP concentrations before treatment, at wk 24 and 48 of therapy with interferon and ribavirin and at wk 72 of follow-up in patients with chronic hepatitis C virus infection (median with 5th/95th percentile; mean as a dotted line; Friedman repeated measures ANOVA, Student-Newman-Keuls method).
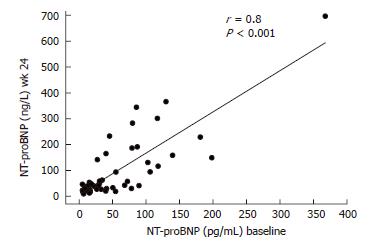
Figure 2 Correlation between plasma NT-proBNP concentrations before treatment and at wk 24 of therapy with interferon and ribavirin in patients with chronic hepatitis C virus infection (Spearman rank order correlation test).
- Citation: Bojunga J, Sarrazin C, Hess G, Zeuzem S. Elevated plasma levels of N-terminal pro-brain natriuretic peptide in patients with chronic hepatitis C during interferon-based antiviral therapy. World J Gastroenterol 2006; 12(36): 5875-5877
- URL: https://www.wjgnet.com/1007-9327/full/v12/i36/5875.htm
- DOI: https://dx.doi.org/10.3748/wjg.v12.i36.5875


