Copyright
©2006 Baishideng Publishing Group Co.
World J Gastroenterol. Sep 21, 2006; 12(35): 5711-5716
Published online Sep 21, 2006. doi: 10.3748/wjg.v12.i35.5711
Published online Sep 21, 2006. doi: 10.3748/wjg.v12.i35.5711
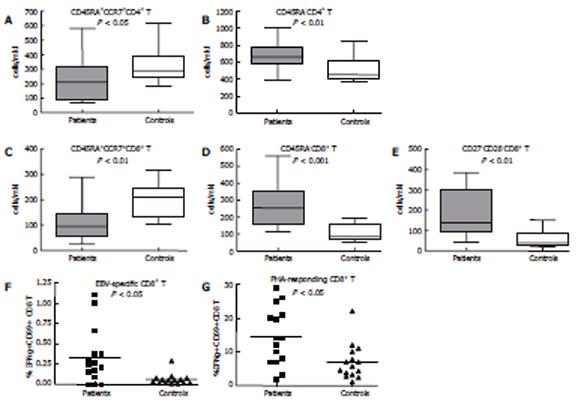
Figure 1 Significant differences detected between patients and control group by immunophenotyping.
Patients were characterized by a decreased absolute number of naive CCCR7+CD45RA+CD4+ (A) and CD8+ (C) T cells, increased absolute number of memory CD45RA-CD4+ (B) and CD8+ (D)T cells, increased absolute number of effector CD28-CD27-CD8+ T cells (E), as well as by increased percentage of IFNγ+CD69+CD8+ T cells after stimulation with EBV peptide GLCTMVL (F) and with PHA (G). Box-and-whiskers indicate the 25-75 percentile and min-max values for each group. Mean values are designated on all plots by a horizontal line. Man-Witney. P values are indicated for each comparison.
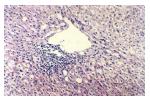
Figure 2 Liver biopsy, showing lymphocyte infiltrate within the lobule and some hepatocyte injury, with mild steatosis displayed in some cells.
- Citation: Petrova M, Muhtarova M, Nikolova M, Magaev S, Taskov H, Nikolovska D, Krastev Z. Chronic Epstein-Barr virus-related hepatitis in immunocompetent patients. World J Gastroenterol 2006; 12(35): 5711-5716
- URL: https://www.wjgnet.com/1007-9327/full/v12/i35/5711.htm
- DOI: https://dx.doi.org/10.3748/wjg.v12.i35.5711


