Copyright
©2006 Baishideng Publishing Group Co.
World J Gastroenterol. Sep 14, 2006; 12(34): 5495-5500
Published online Sep 14, 2006. doi: 10.3748/wjg.v12.i34.5495
Published online Sep 14, 2006. doi: 10.3748/wjg.v12.i34.5495
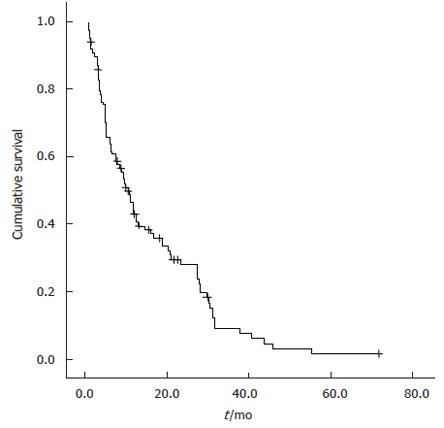
Figure 1 Kaplan-Meier estimate for survival of the whole cohort.
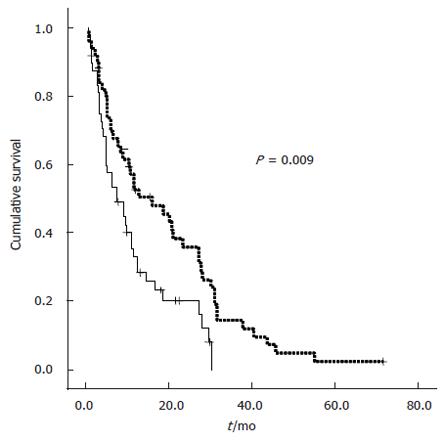
Figure 2 Kaplan-Meier estimate for patients with a serum CRP level < 12 mg/L (dotted line) versus ≥ 12 mg/L (solid line).
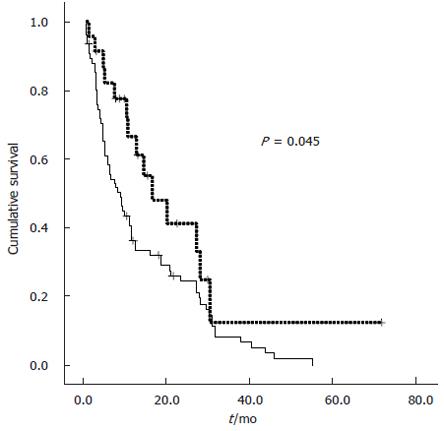
Figure 3 Kaplan-Meier estimate for survival of patients, who underwent resection (dotted line) versus non-resected patients (solid line).
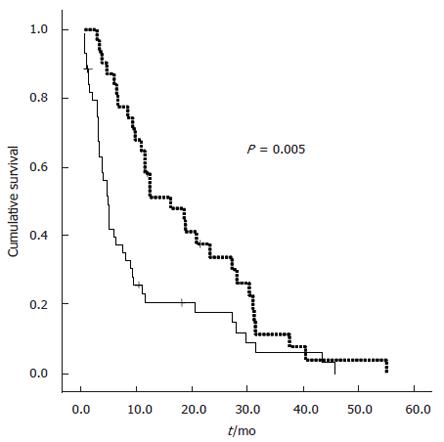
Figure 4 Subgroup analysis of patients without surgical resection: Kaplan-Meier estimate for survival of patients treated with PDT (dotted line) versus non-treated patients (solid line).
- Citation: Gerhardt T, Milz S, Schepke M, Feldmann G, Wolff M, Sauerbruch T, Dumoulin FL. C-reactive protein is a prognostic indicator in patients with perihilar cholangiocarcinoma. World J Gastroenterol 2006; 12(34): 5495-5500
- URL: https://www.wjgnet.com/1007-9327/full/v12/i34/5495.htm
- DOI: https://dx.doi.org/10.3748/wjg.v12.i34.5495


