Copyright
©2006 Baishideng Publishing Group Co.
World J Gastroenterol. Sep 7, 2006; 12(33): 5416-5418
Published online Sep 7, 2006. doi: 10.3748/wjg.v12.i33.5416
Published online Sep 7, 2006. doi: 10.3748/wjg.v12.i33.5416
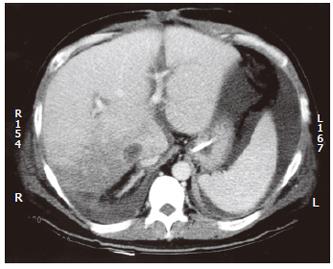
Figure 1 Computed tomography scan showing hypoperfusion at the right posterior segment of the liver graft.
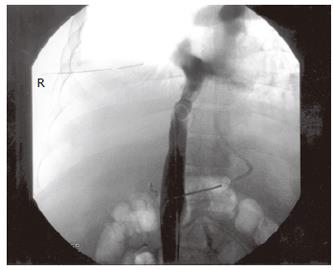
Figure 2 Hepatic veins are not opacified on inferior venacavogram, suggestive of the presence of stenosis at the caval anastomosis.
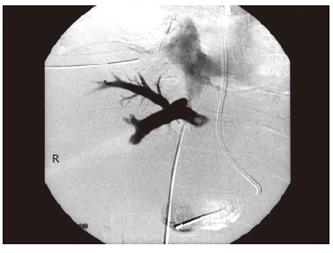
Figure 3 Selective hepatic venogram showing high-grade stenosis at the caval anastomosis.
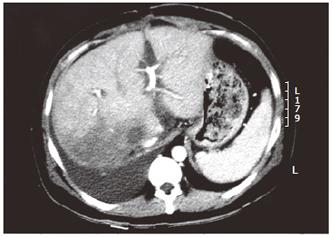
Figure 4 Computed tomography scan showing atrophy of the right posterior segment of the liver graft.
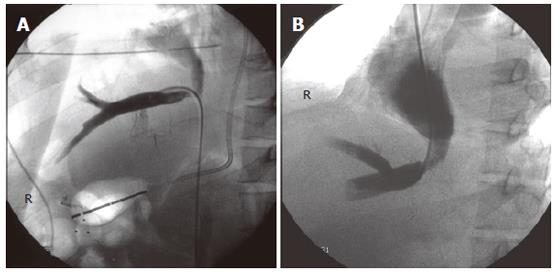
Figure 5 Post-angioplasty (with 10 mm balloon) hepatic venogram showing improvement of the stenosis (A) and the stenotic segment to almost normal caliber (B).
- Citation: Ng SSM, Yu SCH, Lee JFY, Lai PBS, Lau WY. Hepatic venous outflow obstruction after piggyback liver transplantation by an unusual mechanism: Report of a case. World J Gastroenterol 2006; 12(33): 5416-5418
- URL: https://www.wjgnet.com/1007-9327/full/v12/i33/5416.htm
- DOI: https://dx.doi.org/10.3748/wjg.v12.i33.5416


