Copyright
©2006 Baishideng Publishing Group Co.
World J Gastroenterol. Sep 7, 2006; 12(33): 5344-5351
Published online Sep 7, 2006. doi: 10.3748/wjg.v12.i33.5344
Published online Sep 7, 2006. doi: 10.3748/wjg.v12.i33.5344
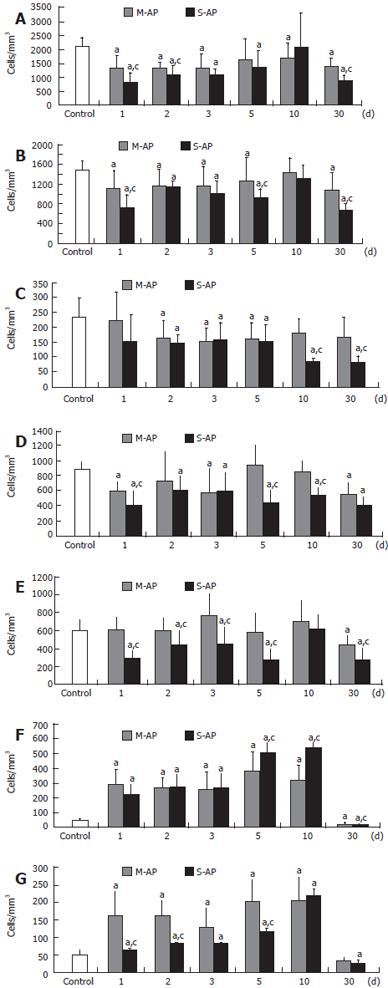
Figure 1 Peripheral blood lymphocytes in patients with AP.
A: Total count; B: CD7+; C: CD19+; D: CD4+; E: CD8+; F: CD69+; G: CD25+. Results are expressed as mean ± SD. aP < 0.05 vs control; cP < 0.05 vs mild AP at the same day of observation.
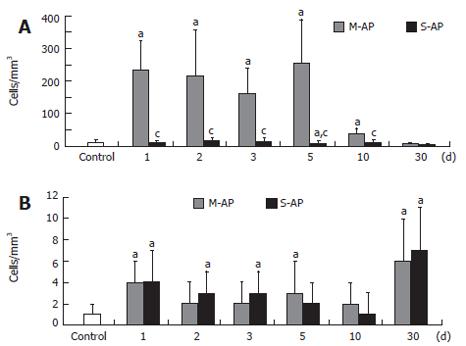
Figure 2 Peripheral blood T-lymphocytes (CD7+) (A) and B-lymphocytes (CD19+) (B) expressing CD122 in patients with AP.
Results are expressed as mean ± SD. aP < 0.05 vs control; cP < 0.05 vs mild AP at the same day of observation.
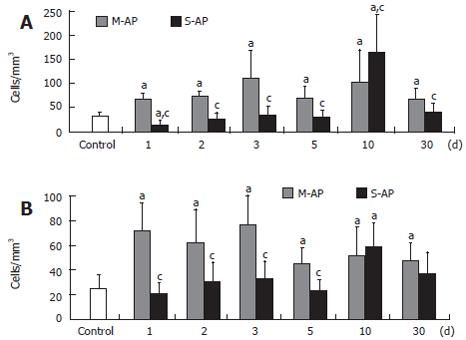
Figure 3 Peripheral blood CD8+ cells expressing CD38 (A) and CD28 (B) in patients with AP.
Results are expressed as mean ± SD. aP < 0.05 vs control; cP < 0.05 vs mild AP at the same day of observation.
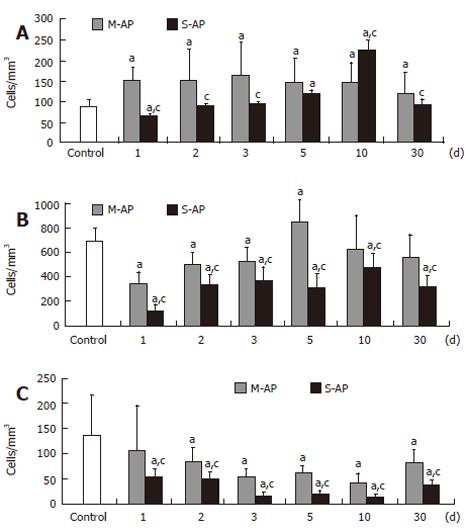
Figure 4 Markers of lymphocyte apoptosis in patients with AP.
Peripheral blood lymphocytes expressing CD95 (A), CD3+ lymphocytes expressing Annexin V (B) and CD19+ lymphocytes expressing Annexin V (C). Results are expressed as mean ± SD. aP < 0.05 vs control; cP < 0.05 vs mild AP at the same day of observation.
- Citation: Pietruczuk M, Dabrowska MI, Wereszczynska-Siemiatkowska U, Dabrowski A. Alteration of peripheral blood lymphocyte subsets in acute pancreatitis. World J Gastroenterol 2006; 12(33): 5344-5351
- URL: https://www.wjgnet.com/1007-9327/full/v12/i33/5344.htm
- DOI: https://dx.doi.org/10.3748/wjg.v12.i33.5344


