Copyright
©2006 Baishideng Publishing Group Co.
World J Gastroenterol. Aug 21, 2006; 12(31): 5071-5074
Published online Aug 21, 2006. doi: 10.3748/wjg.v12.i31.5071
Published online Aug 21, 2006. doi: 10.3748/wjg.v12.i31.5071
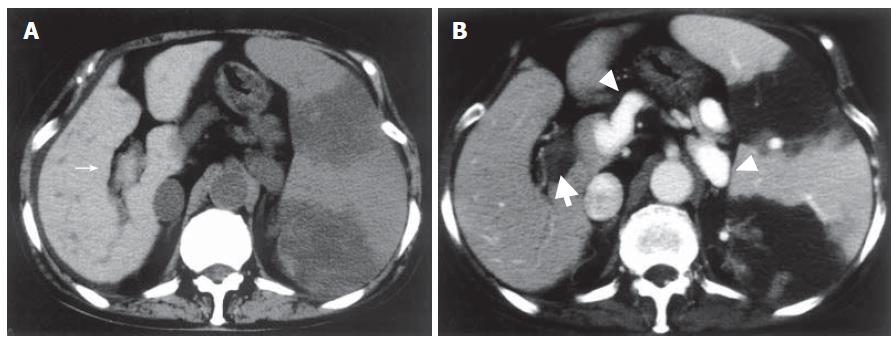
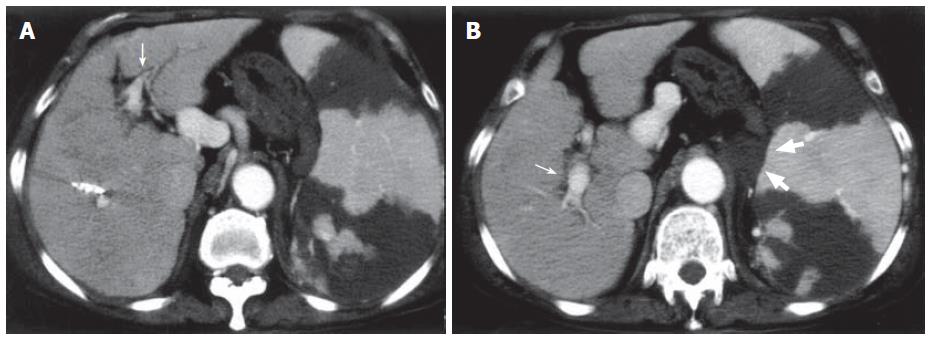
Figure 1 Abdominal CT one week after PSE.
A: Plain CT showing high density lesions in the main portal vein and the 1st right branch (narrow arrow); B: Contrast-enhanced CT revealing no enhancement of portal vein indicating portal thrombosis (thick arrow) and portosystemic shunts (arrow head). Splenic infarction after PSE was also visualized.
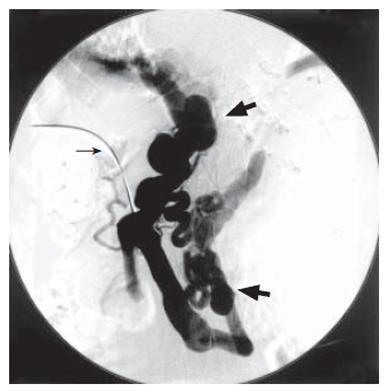
Figure 2 No visualization of main portal vein due to extensive thrombosis (narrow arrow) and visualization of portosystemic shunts such as dilated left gastric vein and splenorenal shunt draining into left renal vein (thick arrow) on percutaneous transhepatic portography.
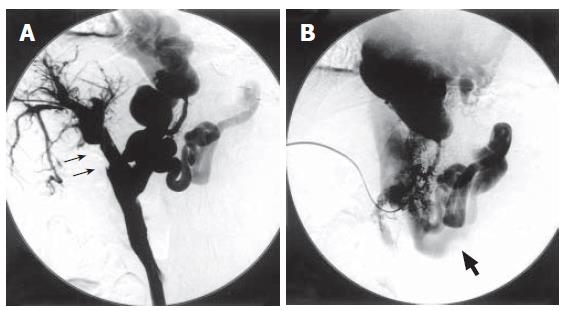
Figure 3 Percutaneous transhepatic portography after catheter-directed thrombolysis.
A: Dissolution of the thrombus in portal vein (narrow arrow); B: Hepatofugal flow into dilated portosystemic shunts (thick arrow: left renal vein).
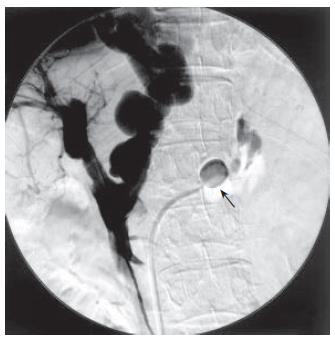
Figure 4 PTP after BRTO.
BRTO was attempted to occlude splenorenal shunt in order to increase portal blood flow. A 7Fr balloon catheter (arrow) was advanced into the outflow pathway of the splenorenal shunt. A total of 10 mL of 5% ethanolamine oleate iopamidol (EOI) was injected and remained stagnant for a day during balloon occlusion.
Figure 5 Contrast-enhanced CT 1 wk after catheter-directed thrombolysis and BRTO.
A: Good patency of the portal vein (narrow arrow); B: Thrombosed splenorenal shunt (thick arrow).
- Citation: Nakai M, Sato M, Sahara S, Kawai N, Kimura M, Maeda Y, Ibata Y, Higashi K. Transhepatic catheter-directed thrombolysis for portal vein thrombosis after partial splenic embolization in combination with balloon-occluded retrograde transvenous obliteration of splenorenal shunt. World J Gastroenterol 2006; 12(31): 5071-5074
- URL: https://www.wjgnet.com/1007-9327/full/v12/i31/5071.htm
- DOI: https://dx.doi.org/10.3748/wjg.v12.i31.5071


