Copyright
©2006 Baishideng Publishing Group Co.
World J Gastroenterol. Aug 21, 2006; 12(31): 5021-5027
Published online Aug 21, 2006. doi: 10.3748/wjg.v12.i31.5021
Published online Aug 21, 2006. doi: 10.3748/wjg.v12.i31.5021
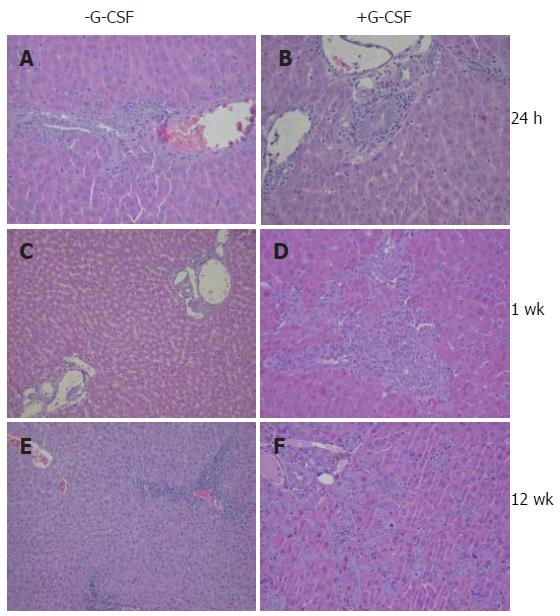
Figure 1 Histology of rat liver after 24 h (A, B), one week (C, D) and 12 wk (E, F) with and without G-CSF treatment showing varying degrees of inflammation and bile duct proliferation.
HE; A, D, F 200 x; B 300 x; C, E 100 x.
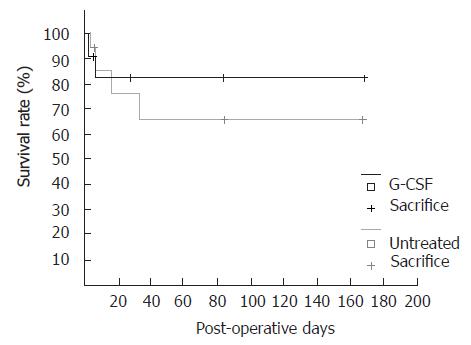
Figure 2 Kaplan-Meier chart of rats after liver transplantation with and without G-CSF treatment.
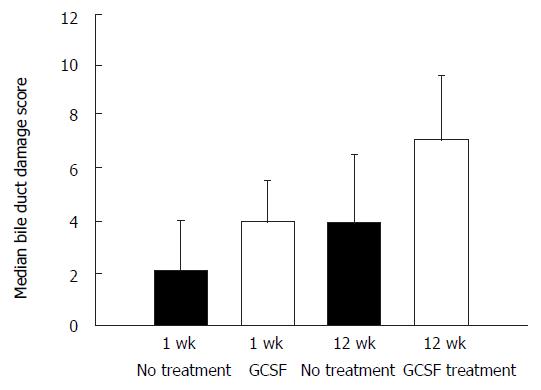
Figure 3 Median bile duct damage score at one and twelve weeks.
- Citation: Dirsch O, Chi H, Ji Y, Gu YL, Broelsch CE, Dahmen U. Administration of granulocyte colony stimulating factor after liver transplantation leads to an increased incidence and severity of ischemic biliary lesions in the rat model. World J Gastroenterol 2006; 12(31): 5021-5027
- URL: https://www.wjgnet.com/1007-9327/full/v12/i31/5021.htm
- DOI: https://dx.doi.org/10.3748/wjg.v12.i31.5021


