Copyright
©2006 Baishideng Publishing Group Co.
World J Gastroenterol. Jan 21, 2006; 12(3): 393-402
Published online Jan 21, 2006. doi: 10.3748/wjg.v12.i3.393
Published online Jan 21, 2006. doi: 10.3748/wjg.v12.i3.393
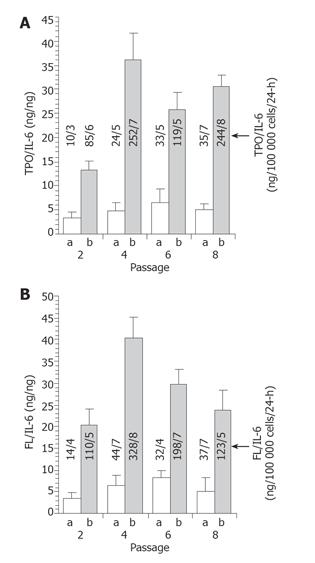
Figure 1 Maintenance of TPO and FL production in vitro.
TPO (A) and FL (B) levels secreted from tfhMSCs and untransduced hMSCs and endogenous IL-6 levels were assayed in the medium after 2, 4, 6, and 8 passages in culture. The level of TPO and FL in the supernatant was normalized to the level of endogenous IL-6 and the ratio was plotted for passage number. In addition, the absolute values (ng/100 000 cells/24 h) of TPO, FL and IL-6 are shown (arrow). Data were obtained from triplicate ELISA measurements. a = untransduced hMSCs; b = tfhMSCs.
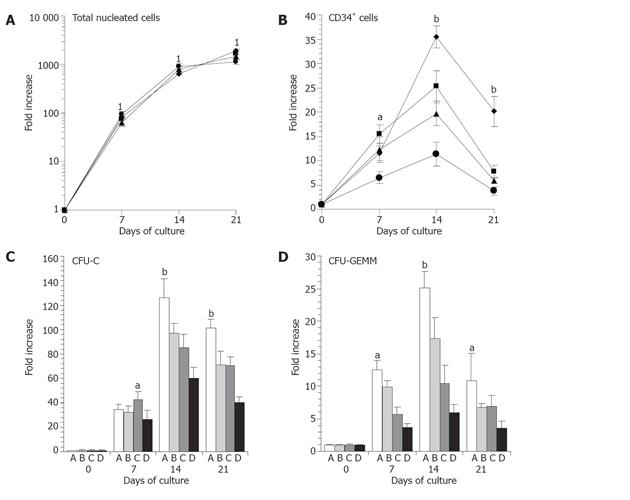
Figure 2 Effects of several culture systems on ex vivo expansion of hematopoietic progenitors.
UCB CD34+ cells were cultured in serum-containing medium using four culture systems. A: Total nucleated cells; B: CD34+ cells; C: Total colony-forming units in culture (CFU-C); D: Mixed colonies containing erythroid and myeloid cells and megakaryocytes (CFU-GEMM). The results represent the mean fold increase ± SD of three different experiments on d 7, 14, and 21 of culture. 1No significant differences between different culture systems. aP < 0.05, bP < 0.01 as compared with other three groups. ◆= tfhMSCs coculture system; ▓= hMSCs coculture system; ▲= cytokines culture system; ● = hMSCs (TPO/FL-free) culture system. A = tfhMSCs coculture system; B=hMSCs coculture system; C = cytokines culture system; D = hMSCs (TPO/FL-free) culture system.
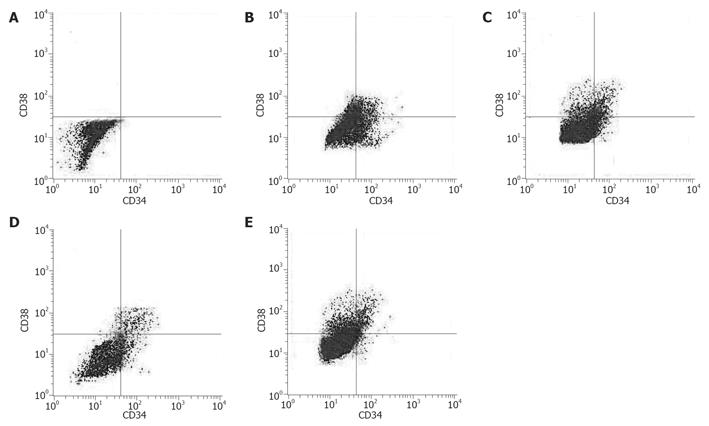
Figure 3 Comparison of CD34 and CD38 expression among hematopoietic cells in different culture systems.
CD34+ cells derived from a single delivery were cultured using different culture systems in serum-containing medium. On d 14 of culture, aliquots of harvested cells were subjected to flow cytometric analysis. A = Negative control; B = tfhMSCs coculture system; C = hMSCs coculture system; D = cytokines culture system; E = hMSCs (TPO/FL-free) culture system.
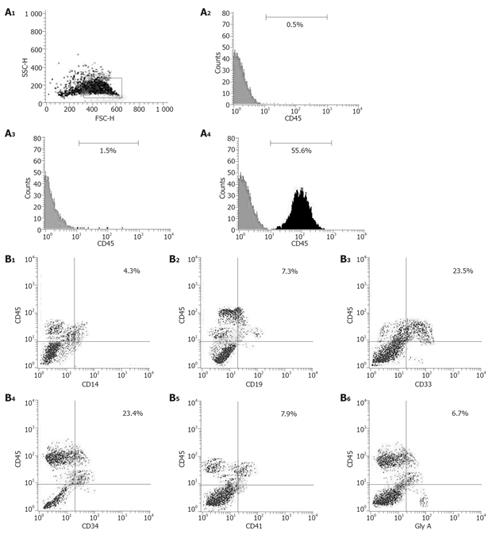
Figure 4 Determination of human hematopoietic reconstitution in NOD/SCID mice 7 wk after transplantation.
A: Expression of human CD45 on bone marrow cells (BMC) collected from NOD/SCID mice 7 wk after transplantation; (A1): Cells in the gated area were analyzed by flow cytometry; (A2): Bone marrow cells (BMC) from an untransplanted mouse (negative control); (A3): BMC from a mouse transplanted with 1 ×10⁵ human CD34+ cells before culture; (A4): BMC from a mouse transplanted with cells obtained after 14-d cultivation of those 100 000 human CD34+ cells in the tfhMSCs coculture system; B1-B6: Specific subsets of human CD45+ cells in bone marrow cells of the NOD/SCID mouse transplanted with UCB cells after the coculture. Harvested cells were stained with PE-conjugated CD45 and various FITC-conjugated monoclonal antibodies.
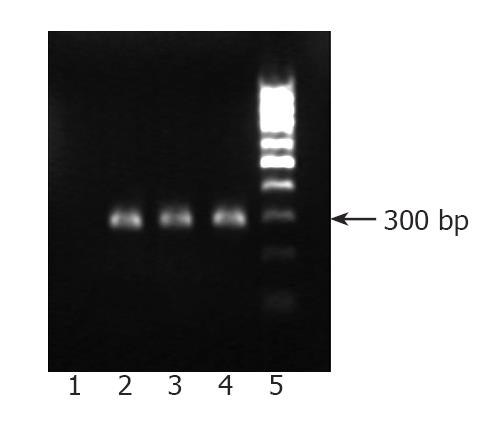
Figure 5 PCR analysis of human Alu sequence in NOD/SCID mice 7 wk after transplantation.
DNA was extracted from the bone marrow and peripheral blood cells of NOD/SCID mice 7 wk after transplantation. PCR analysis demonstrated the presence of human hematopoietic cells in the bone marrow (lane 2) and peripheral blood cells (lane 3) of NOD/SCID mice. DNA extracted from human UCB cells was used as a positive control (lane 4). Negative control is shown in lane 1 and DNA marker is shown in lane 5.
- Citation: Xie CG, Wang JF, Xiang Y, Qiu LY, Jia BB, Wang LJ, Wang GZ, Huang GP. Cocultivation of umbilical cord blood CD34+ cells with retro-transduced hMSCs leads to effective amplification of long-term culture-initiating cells. World J Gastroenterol 2006; 12(3): 393-402
- URL: https://www.wjgnet.com/1007-9327/full/v12/i3/393.htm
- DOI: https://dx.doi.org/10.3748/wjg.v12.i3.393


