Copyright
©2006 Baishideng Publishing Group Co.
World J Gastroenterol. Aug 7, 2006; 12(29): 4689-4693
Published online Aug 7, 2006. doi: 10.3748/wjg.v12.i29.4689
Published online Aug 7, 2006. doi: 10.3748/wjg.v12.i29.4689
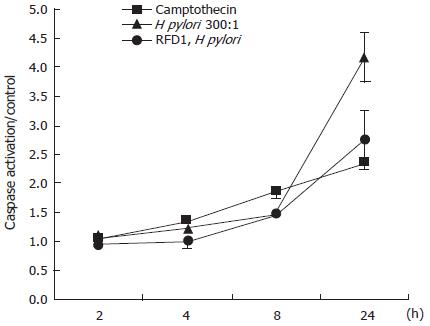
Figure 1 Total caspase activation detected using a colorometric assay.
(means of the treatments / control (untreated) samples.
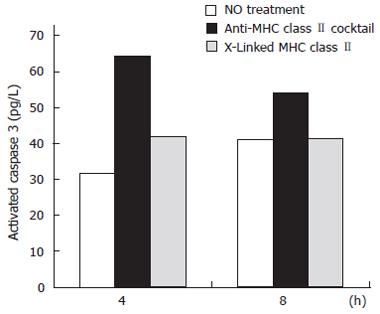
Figure 2 The effects of ligating vs crosslinking N87 cell surface MHC class II molecules on caspase 3 activation.
Using the apoptosis cytometric bead array kit, beads exposed to the samples were run through a flow cytometer to obtain MFI data. These results were normalized to activated caspase 3 standards to give values expressed as pg/mL of activated caspase 3.
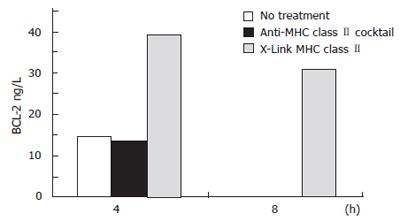
Figure 3 The effects of ligating vs crosslinking N87 cell surface MHC class II molecules on BCL-2 expression.
Using the apoptosis cytometric bead array kit, beads exposed to the samples were run through a flow cytometer to obtain MFI data. These results were normalized to BCL-2 standards to give values expressed as ng/L of BCL-2.
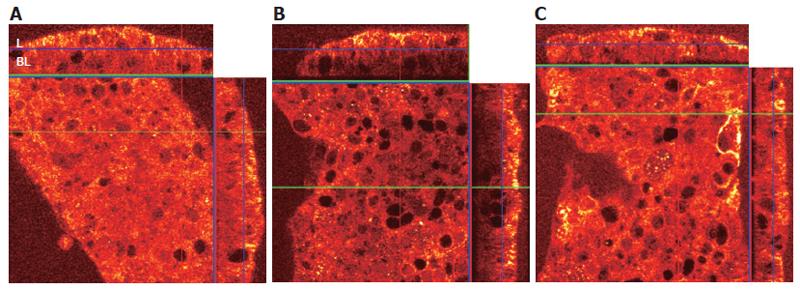
Figure 4 A: Viewing the X-Z panels, the FADD (stained red, with higher densities staining yellow) in untreated (control) cells distributed equally throughout the cytoplasm.
“L” represents the apical (lumenal) surface and “BL” represents the basolateral surface of the N87 monolayer; B: Labeled FADD in cells treated with the Fas trimerizing antibody is recruited to the apical surface, leaving much of the cytoplasm with reduced FADD staining; C: When the anti-MHC class II IgM RFD1 is applied to the cell monolayer 30 min prior to treatment with the Fas agonist IPO4 IgM, the recruitment of FADD to the cell surface is markedly reduced.
- Citation: Bland DA, Suarez G, Beswick EJ, Sierra JC, Reyes VE. H pylori receptor MHC class II contributes to the dynamic gastric epithelial apoptotic response. World J Gastroenterol 2006; 12(29): 4689-4693
- URL: https://www.wjgnet.com/1007-9327/full/v12/i29/4689.htm
- DOI: https://dx.doi.org/10.3748/wjg.v12.i29.4689


