Copyright
©2006 Baishideng Publishing Group Co.
World J Gastroenterol. Jul 28, 2006; 12(28): 4504-4510
Published online Jul 28, 2006. doi: 10.3748/wjg.v12.i28.4504
Published online Jul 28, 2006. doi: 10.3748/wjg.v12.i28.4504
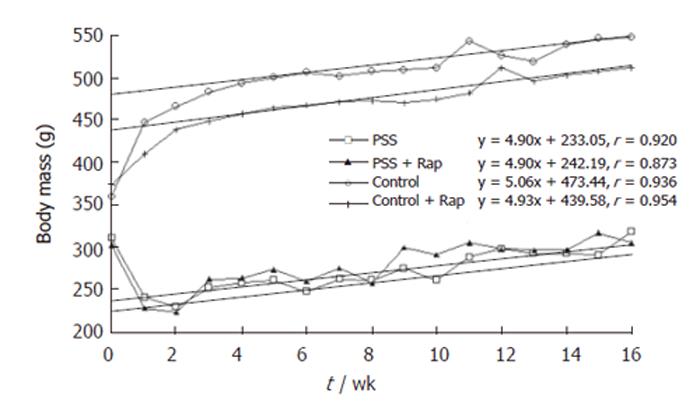
Figure 1 Body mass change per week.
r = Pearson correlation coefficient.
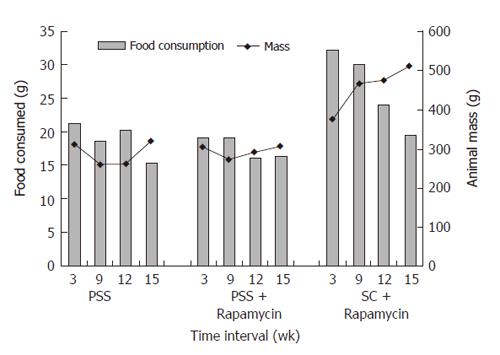
Figure 2 Food intake and body weight in PSS, PSS + rapamycin and SC + Rapamycin.
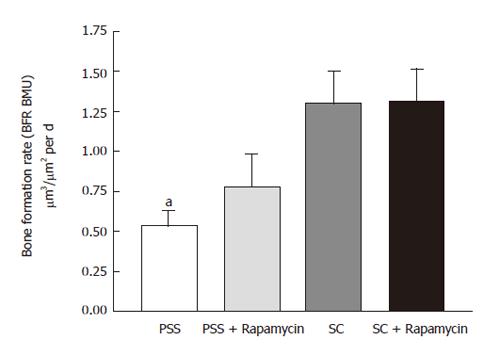
Figure 3 Effect of portasystemic shunting and rapamycin administration on dynamic bone formation in the proximal tibias of rats.
BFRBMU = Bone formation rate at the level of the basic multi-cellular unit. (mean ± SE. aP < 0.05 vs SC).
- Citation: Merwe SWVD, Conradie MM, Bond R, Olivier BJ, Fritz E, Nieuwoudt M, Delport R, Slavik T, Engelbrecht G, Kahn D, Shephard EG, Kotze MJ, Villiers NP, Hough S. Effect of rapamycin on hepatic osteodystrophy in rats with portasystemic shunting. World J Gastroenterol 2006; 12(28): 4504-4510
- URL: https://www.wjgnet.com/1007-9327/full/v12/i28/4504.htm
- DOI: https://dx.doi.org/10.3748/wjg.v12.i28.4504


