Copyright
©2006 Baishideng Publishing Group Co.
World J Gastroenterol. Jul 28, 2006; 12(28): 4492-4497
Published online Jul 28, 2006. doi: 10.3748/wjg.v12.i28.4492
Published online Jul 28, 2006. doi: 10.3748/wjg.v12.i28.4492
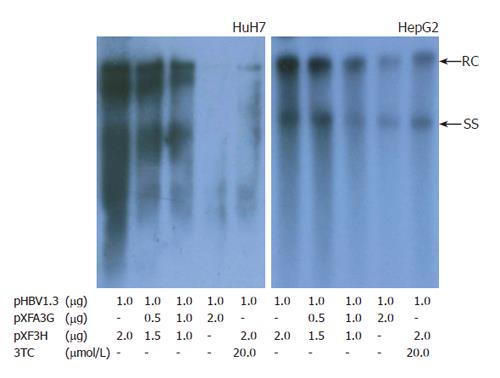
Figure 1 Effect of APOBEC3G on HBV replication in cotransfected hepatoma cells.
Cells were treated with lipofectamine 2000 reagents, and viral replicative DNA intermediates were analyzed with southern blotting 3 d after transfection. Numbers at the end of the lines indicate the amount of transfected plasmid DNA in micrograms. HBV, hepatitis B virus; RC, relaxed circular DNA; SS, single -stranded DNA.
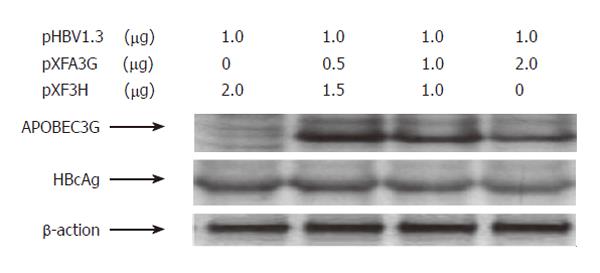
Figure 2 Western blot analysis of cytoplasmic extracts from Huh7 cells cotransfected with indicated plasmids.
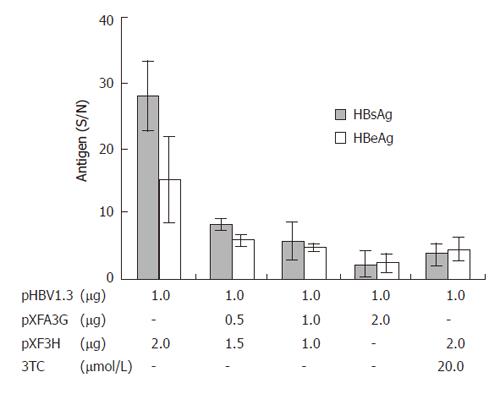
Figure 3 Effect of APOBEC3G on HBsAg and HBeAg secretion in the media of cotransfected Huh7 cells 3 d after transfection.
HBsAg and HBeAg levels (S/N) were significantly reduced (error bar indicate standard error). Numbers at the end of the lines indicate the amount of transfected plasmid DNA in micrograms.
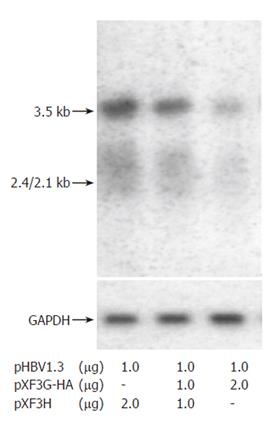
Figure 4 Effect of APOBEC3G on HBV RNA expression.
Northern blot analysis of HBV transcripts from Huh7 cells co-transfected with indicated plasmids. The same blot was hybridized with a glyceraldehyde phosphate dehydrogenase (GAPDH) DNA probe as an internal control.
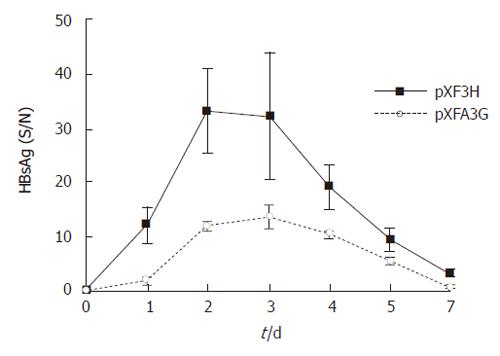
Figure 5 Serum HBsAg levels in APOBEC3G treated mice.
HBsAg levels(S/N) in the sera of BALB/c mice were significantly reduced after treatment with the APOBEC3G expression plasmids (error bar indicate standard error) in the indicated time points, n = 6 per treatment group.
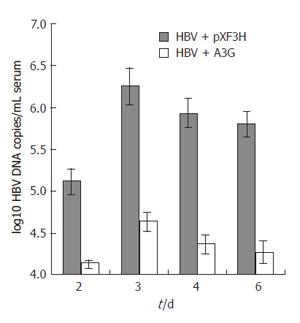
Figure 6 Real time PCR quantification of HBV DNA in the sera of mice treated with APOBEC3G expression plasmid.
BALB/c mice were coinjected with pHBV1.3 vector (10 μg ) and APOBEC3G expression plasmid (10 μg) 3 d after injection. HBV DNA levels (mean ± SD) of sera were determined by quantitative PCR, n = 6 per treatment group.
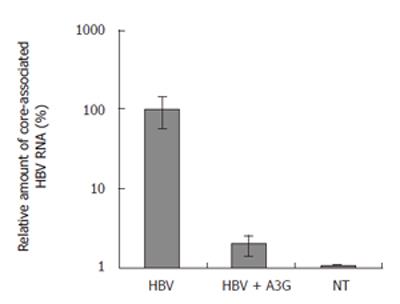
Figure 7 Real time PCR quantification of core-associated HBV RNA in the liver of mice treated with indicated plasmids.
BALB/c mice were coinjected with pHBV1.3 vector (10 μg) and APOBEC3G expression plasmid (10 μg) 3 d after injection. The levels of liver HBV RNA were determined by quantitative RT-PCR, normalized to GAPDH mRNA and are reported as a ratio of HBV mRNA/GAPDH mRNA (mean ± SD). n = 6 per treatment group.
-
Citation: Lei YC, Hao YH, Zhang ZM, Tian YJ, Wang BJ, Yang Y, Zhao XP, Lu MJ, Gong FL, Yang DL. Inhibition of hepatitis B virus replication by APOBEC3G
in vitro andin vivo . World J Gastroenterol 2006; 12(28): 4492-4497 - URL: https://www.wjgnet.com/1007-9327/full/v12/i28/4492.htm
- DOI: https://dx.doi.org/10.3748/wjg.v12.i28.4492


