Copyright
©2006 Baishideng Publishing Group Co.
World J Gastroenterol. Jul 21, 2006; 12(27): 4377-4382
Published online Jul 21, 2006. doi: 10.3748/wjg.v12.i27.4377
Published online Jul 21, 2006. doi: 10.3748/wjg.v12.i27.4377
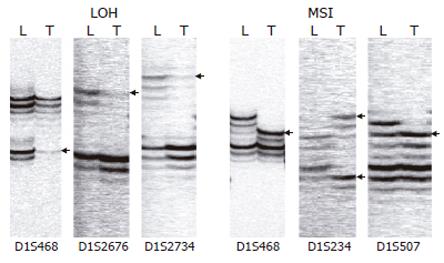
Figure 1 Representative examples of LOH and MSI at various loci of chromosome 1p36 (L, leucocyte DNA; T, tumor DNA).
Arrows indicate the abnormalities
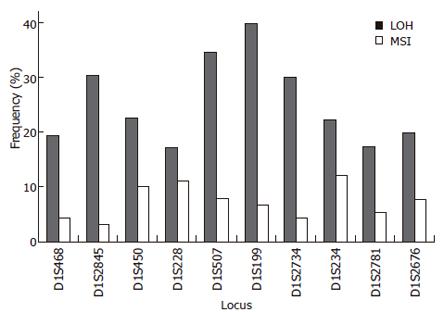
Figure 2 LOH and MSI frequencies at each locus of chromosome 1p36-pter.
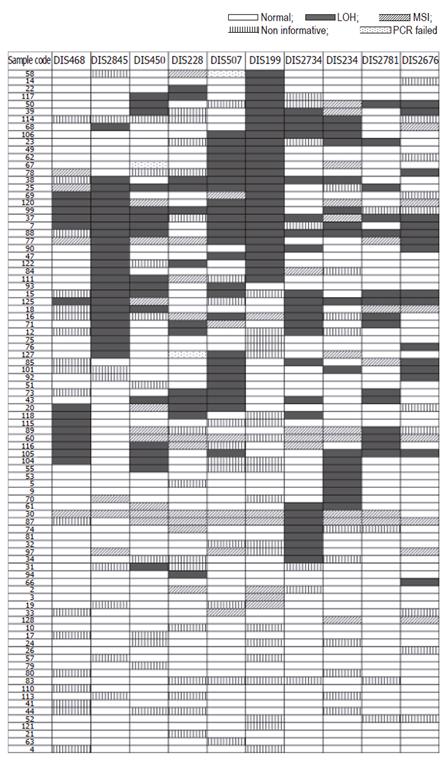
Figure 3 Fine mapping of the chromosome 1p36-pter in 90 CCA.
The common loss regions were located at D1S2845 and the 25.5-cM region between D1S507 and D1S2734.
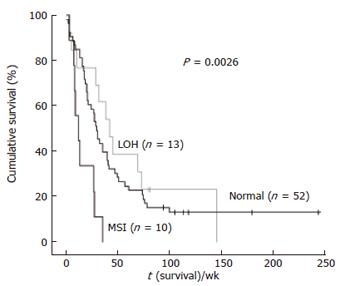
Figure 4 The Kaplan-Meier survival curves showed a poor prognosis in patients who demonstrated MSI at D1S228.
Non informative cases were excluded.
- Citation: Limpaiboon T, Tapdara S, Jearanaikoon P, Sripa B, Bhudhisawasdi V. Prognostic significance of microsatellite alterations at 1p36 in cholangiocarcinoma. World J Gastroenterol 2006; 12(27): 4377-4382
- URL: https://www.wjgnet.com/1007-9327/full/v12/i27/4377.htm
- DOI: https://dx.doi.org/10.3748/wjg.v12.i27.4377


