Copyright
©2006 Baishideng Publishing Group Co.
World J Gastroenterol. Jul 14, 2006; 12(26): 4130-4136
Published online Jul 14, 2006. doi: 10.3748/wjg.v12.i26.4130
Published online Jul 14, 2006. doi: 10.3748/wjg.v12.i26.4130
Figure 1 Alphastatin inhibit HUVECs migration induced by HGF( crystatl violet stain, × 100).
All data shown as mean ± SD. aP < 0.05; bP < 0.01 vs control group.
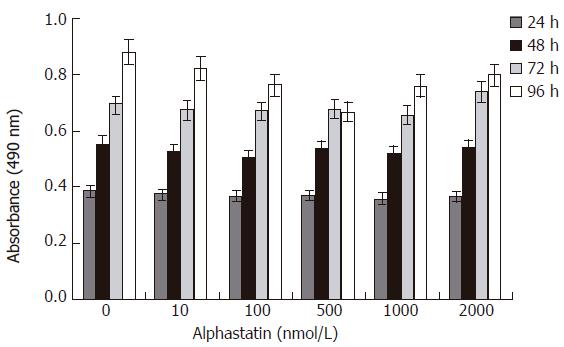
Figure 2 Alphastatin has no effect on HUVECs proliferation.
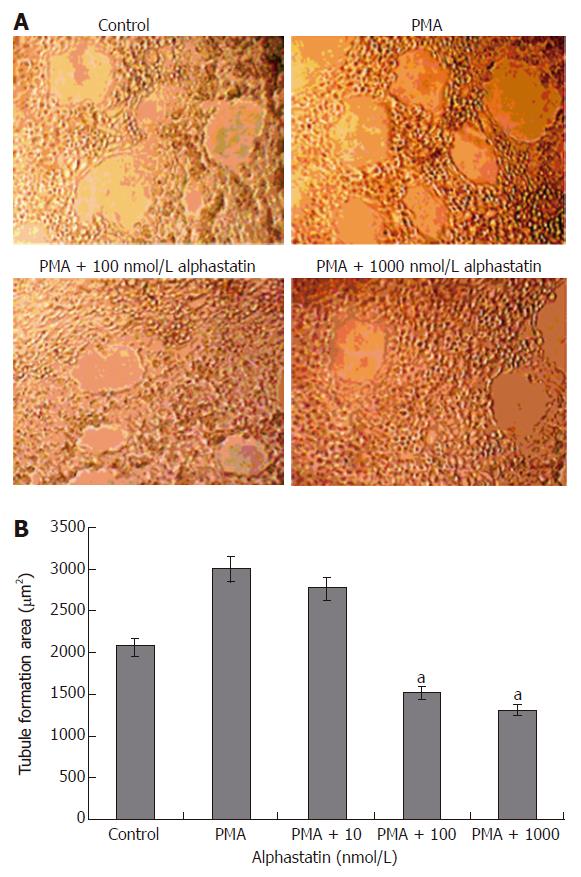
Figure 3 Alphastatin inhibit HUVECs tubule formation in response to PMA.
All data shown as mean ± SD. aP < 0.05 vs control group.
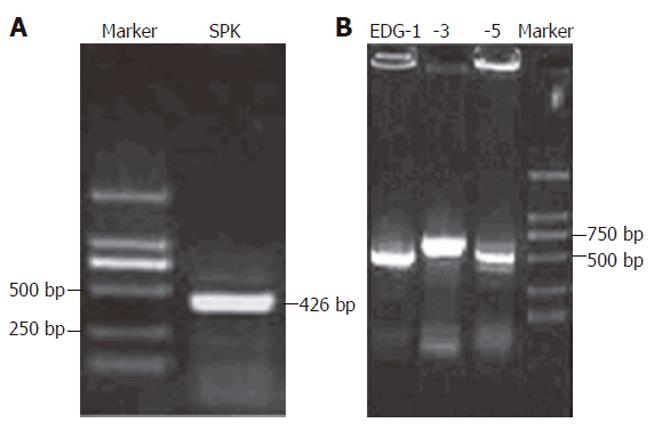
Figure 4 Expression of SPK , EDG-1, EDG-3, EDG-5 in HUVECs.
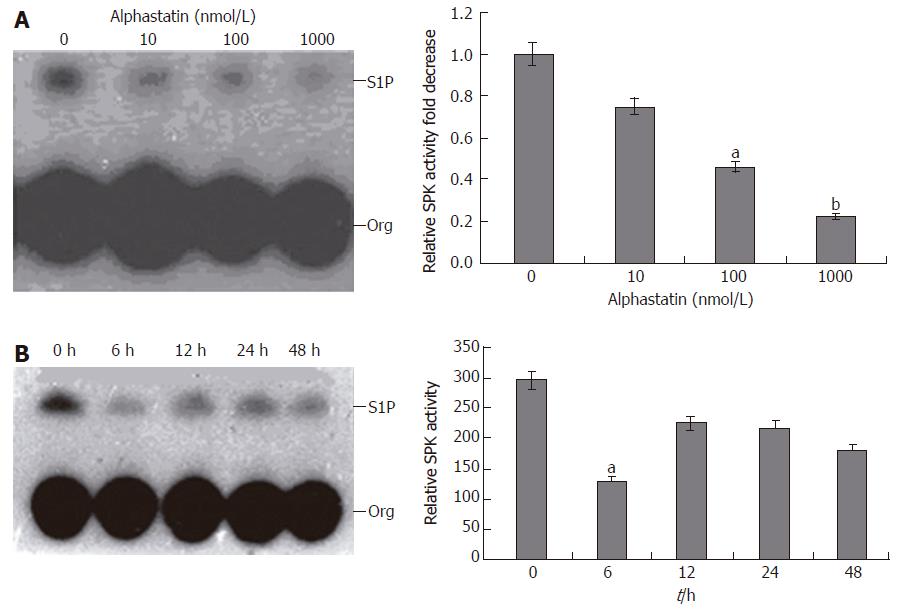
Figure 5 Alphastatin downregulate HUVECs SPK activity in a dose-dependent manner.
HUVECs SPK activity reached a minimum value at 6 h. All data shown as mean ± SD. A: aP < 0.05; bP < 0.01 vs 0 nmol/L alphastatin; B: aP < 0.05 vs 0 h group.
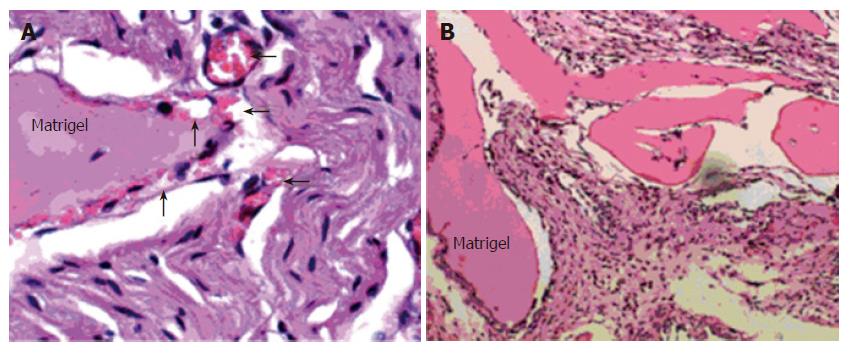
Figure 6 Alphastatin inhibit new capillaries formation on Matrigel plug (original magnification × 100).
A: Many newly formed capillaries full of red blood cells (arrow); B: Granuloma formation without significant neovasculature.
Figure 7 Factor-VIII staining revealed decreased blood vessel density in alphastatin-treated group vs PBS group (× 400).
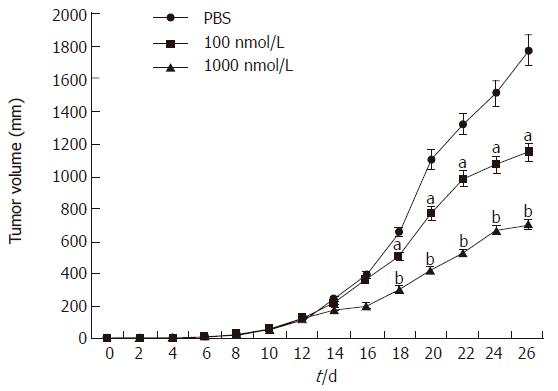
Figure 8 Animals injected with alphastatin exhibited a significantly reduced tumor volume.
All data shown as mean ± SD. aP < 0.05; bP < 0.01 vs PBS group.
- Citation: Chen L, Li T, Li R, Wei B, Peng Z. Alphastatin downregulates vascular endothelial cells sphingosine kinase activity and suppresses tumor growth in nude mice bearing human gastric cancer xenografts. World J Gastroenterol 2006; 12(26): 4130-4136
- URL: https://www.wjgnet.com/1007-9327/full/v12/i26/4130.htm
- DOI: https://dx.doi.org/10.3748/wjg.v12.i26.4130


