Copyright
©2006 Baishideng Publishing Group Co.
World J Gastroenterol. Jul 7, 2006; 12(25): 4064-4070
Published online Jul 7, 2006. doi: 10.3748/wjg.v12.i25.4064
Published online Jul 7, 2006. doi: 10.3748/wjg.v12.i25.4064
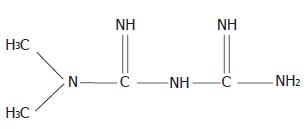
Figure 1 Structure of metformin (dimethylbiguanide).
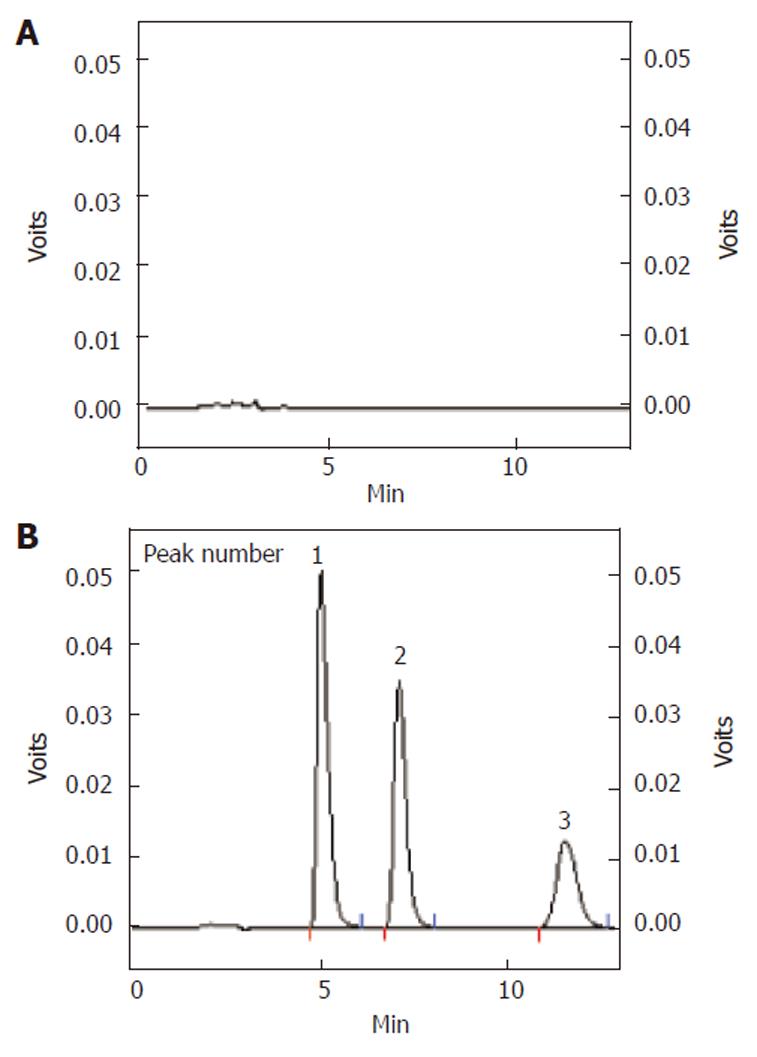
Figure 2 Representative chromatograms of blank (A) and in situ perfusion (B) samples containing metformin, doxofylline and phenol red (1: metformin; 2: doxofylline; 3: phenol red).
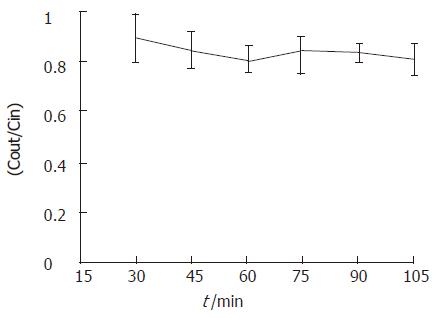
Figure 3 Approach to steady-state for metformin existing in the intestinal perfusate (n = 5).
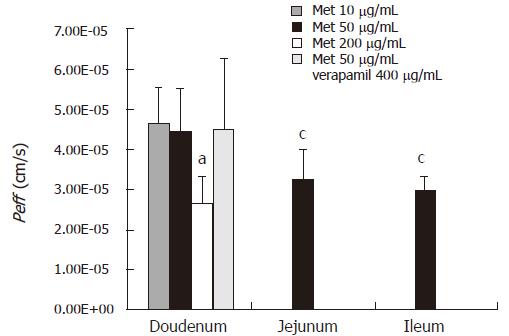
Figure 4 Effective permeability, Peff (cm/s) of metformin using single-pass intestinal perfusion.
For each region, Peff of metformin was determined at 50 μg/mL. For duodenum segment, Peff of metformin was determined at 10, 50, 200 μg/mL, as well as 50 μg/mL with addition of verapamil. The data were presented as mean ± SD (n = 5 in each group). aP < 0.05 vs 10 and 50 μg/mL metformin in duodenum; cP < 0.05 vs 50 μg/mL metformin in duodenum.
- Citation: Song NN, Li QS, Liu CX. Intestinal permeability of metformin using single-pass intestinal perfusion in rats. World J Gastroenterol 2006; 12(25): 4064-4070
- URL: https://www.wjgnet.com/1007-9327/full/v12/i25/4064.htm
- DOI: https://dx.doi.org/10.3748/wjg.v12.i25.4064


