Copyright
©2006 Baishideng Publishing Group Co.
World J Gastroenterol. Jul 7, 2006; 12(25): 4038-4043
Published online Jul 7, 2006. doi: 10.3748/wjg.v12.i25.4038
Published online Jul 7, 2006. doi: 10.3748/wjg.v12.i25.4038
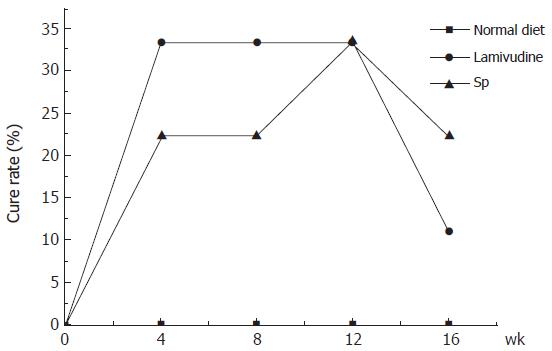
Figure 1 Rate of responses following therapy.
Thirty-three percent (3 of 9) of HBV-Tg receiving lamivudine became completely negative for HBV-DNA compared with 22% (2 of 9) of HBV-Tg receiving the effective ingredient of Sp 8 wk after the start of therapy. They had the same cure rate (33%, 3 of 9) 12 wk after the start of therapy. But the inhibitory effect could not last long. A rebound phenomenon could be found 4 wk after withdrawal of medication. HBV-Tg receiving normal diet did not show such therapeutic response.
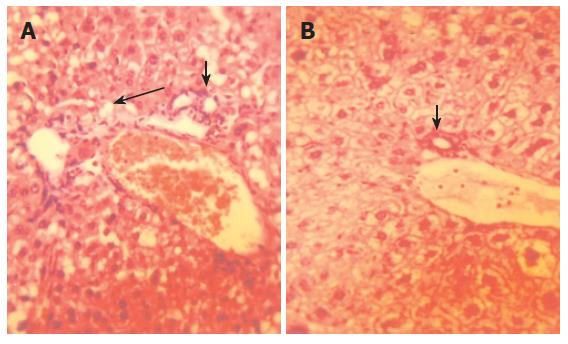
Figure 2 Representative examples of haematoxylin and eosin (HE) staining of HBV-Tg liver (× 400).
The expression of infiltrating lymphocyte was strongly positive (white arrow) before drug administration. The structure of hepatic lobule was obscure and the swelling degree of liver cells was serious. Many vacuoles (black arrow) could be seen in (A). However, these findings were alleviated after 10 wk of therapy by Sp (B).
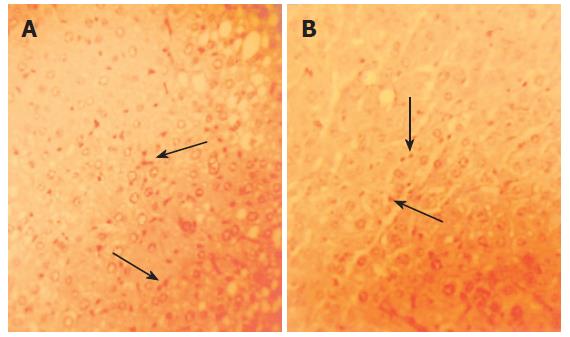
Figure 3 Representative examples of orcein staining of HBV-Tg liver (× 400).
HBsAg was seen as nigger-brown granules before drug administration (A) and after 10 wk of therapy by Sp (B). However, a decrease in the signals for HBsAg was seen in (B) compared with that in (A).
-
Citation: Wang R, Du ZL, Duan WJ, Zhang X, Zeng FL, Wan XX. Antiviral treatment of hepatitis B virus-transgenic mice by a marine organism,
Styela plicata . World J Gastroenterol 2006; 12(25): 4038-4043 - URL: https://www.wjgnet.com/1007-9327/full/v12/i25/4038.htm
- DOI: https://dx.doi.org/10.3748/wjg.v12.i25.4038


