Copyright
©2006 Baishideng Publishing Group Co.
World J Gastroenterol. Jul 7, 2006; 12(25): 3999-4003
Published online Jul 7, 2006. doi: 10.3748/wjg.v12.i25.3999
Published online Jul 7, 2006. doi: 10.3748/wjg.v12.i25.3999
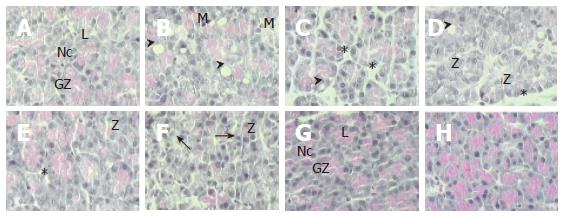
Figure 1 Light-microscopic sections of pancreas (X 133) from 0 h (A) and rats with caerulein-induced acute pancreatitis at 9 h (B), 24 h (C), 3 d (D), 5 d (E), 15 d (F), 30 d (G) and 60 d (H).
Normal pancreatic acinus (0 h) shows zymogen granules (GZ) concentrated in the apical pole of the cell close to the acinar lumen (L). The basal region of the cell contains nucleus (N). In AP, PMN infiltration (M), vacuoles (arrowhead), edema (star), zymogen granule depletion (z) and acinar disorganization (arrow) were observed on d 15. On d 30, pancreatic acinus appearance was almost indistinguishable from that at 0 h.
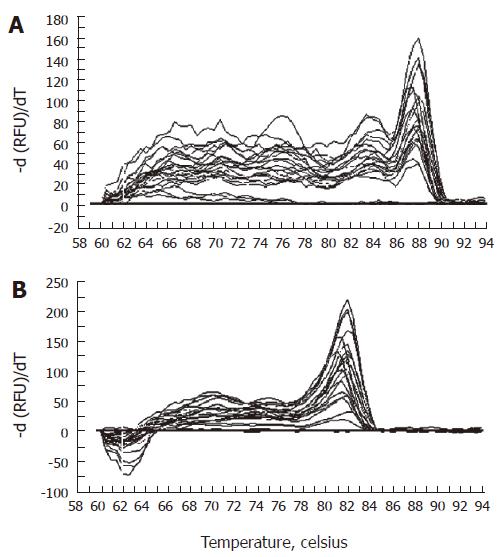
Figure 2 DNA melting curve analysis of amplification products for PAP mRNA (A) and L13A (B).
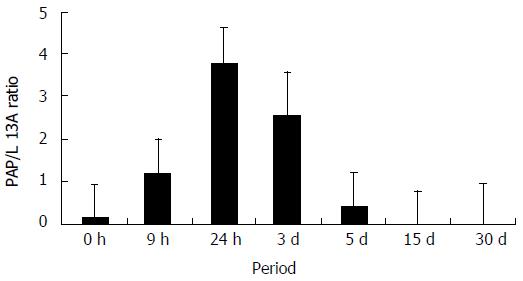
Figure 3 Relative quantification of PAP mRNA in caerulein-induced pancreatitis.
Absolute quantification of PAP mRNA as copies was normalized to copies of L13A as determined from standard curves. All data are mean ± SE.
- Citation: Magaña-Gómez J, López-Cervantes G, Barca AMCL. Caerulin-induced pancreatitis in rats: Histological and genetic expression changes from acute phase to recuperation. World J Gastroenterol 2006; 12(25): 3999-4003
- URL: https://www.wjgnet.com/1007-9327/full/v12/i25/3999.htm
- DOI: https://dx.doi.org/10.3748/wjg.v12.i25.3999


