Copyright
©2006 Baishideng Publishing Group Co.
World J Gastroenterol. Jun 28, 2006; 12(24): 3891-3894
Published online Jun 28, 2006. doi: 10.3748/wjg.v12.i24.3891
Published online Jun 28, 2006. doi: 10.3748/wjg.v12.i24.3891
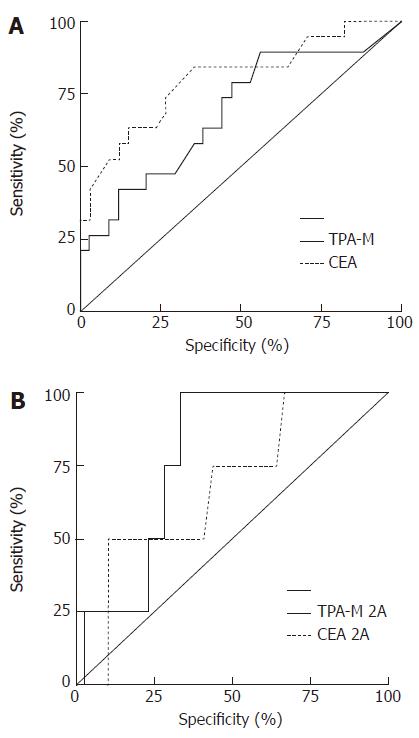
Figure 1 ROC curve for CEA and TPA-M in the first (A) and second (B) postoperative year among patients with colorectal cancer.
- Citation: Fernandes LC, Kim SB, Saad SS, Matos D. Value of carcinoembryonic antigen and cytokeratins for the detection of recurrent disease following curative resection of colorectal cancer. World J Gastroenterol 2006; 12(24): 3891-3894
- URL: https://www.wjgnet.com/1007-9327/full/v12/i24/3891.htm
- DOI: https://dx.doi.org/10.3748/wjg.v12.i24.3891


