Copyright
©2006 Baishideng Publishing Group Co.
World J Gastroenterol. Jun 28, 2006; 12(24): 3854-3858
Published online Jun 28, 2006. doi: 10.3748/wjg.v12.i24.3854
Published online Jun 28, 2006. doi: 10.3748/wjg.v12.i24.3854
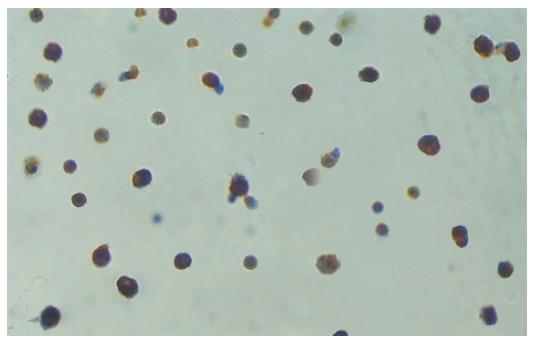
Figure 1 Lysozyme immunohistochemical staining of the Kupffer cells.
The cytoplasms of the Kupffer cells were stained brown. The percentage of Kupffer cells in the adherent cells was over 90%.
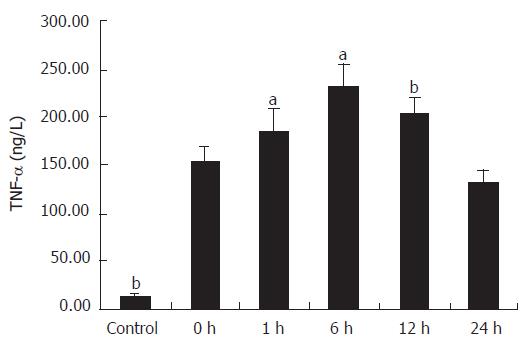
Figure 2 Comparison of TNF-α production in supernatant of Kupffer cells.
(n = 8, mean ± SE, aP < 0.05 compared with the next group, bP < 0.01 compared with the next group.)
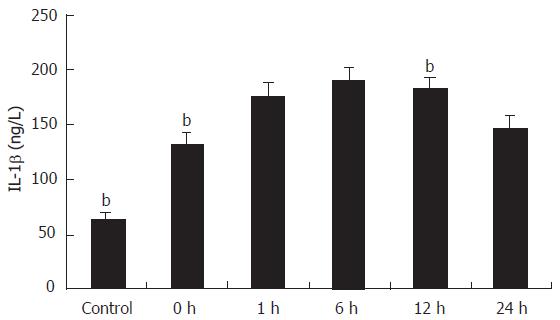
Figure 3 Comparison of IL-1β production in supernatant of Kupffer cells.
(n = 8, mean ± SE, bP < 0.01 compared with the next group.)
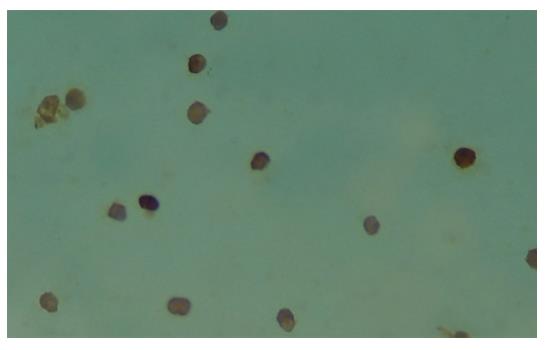
Figure 4 Immunohistochemical staining of MIP-1α in Kupffer cells in IRI group at 12 h’s interval SP × 400.
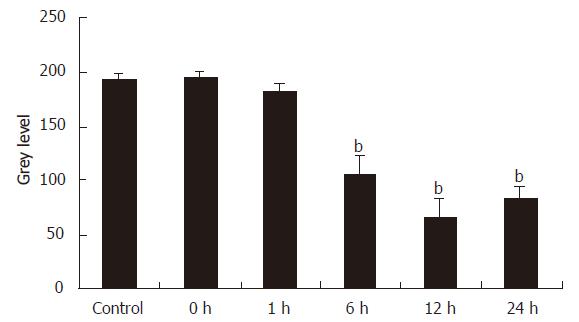
Figure 5 The synthesis of MIP-1α protein in Kupffer cells tested by immunohistochemical (n = 8, mean ± SE, bP < 0.
01 compared with control group).
Figure 6 A: Photograph of the MIP-1α mRNA expression in Kupffer cells tested by RT-PCR; B: Photograph of the GAPDH mRNA expression in Kupffer cells tested by RT-PCR.
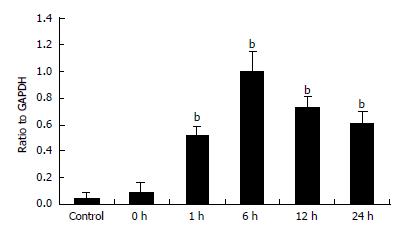
Figure 7 Quantitative data of MIP-1α mRNA levels (n = 8, mean ± SE, bP < 0.
01 compared with control group).
- Citation: Ma W, Wang ZR, Shi L, Yuan Y. Expression of macrophage inflammatory protein-1α in Kupffer cells following liver ischemia or reperfusion injury in rats. World J Gastroenterol 2006; 12(24): 3854-3858
- URL: https://www.wjgnet.com/1007-9327/full/v12/i24/3854.htm
- DOI: https://dx.doi.org/10.3748/wjg.v12.i24.3854


