Copyright
©2006 Baishideng Publishing Group Co.
World J Gastroenterol. Jun 28, 2006; 12(24): 3848-3853
Published online Jun 28, 2006. doi: 10.3748/wjg.v12.i24.3848
Published online Jun 28, 2006. doi: 10.3748/wjg.v12.i24.3848
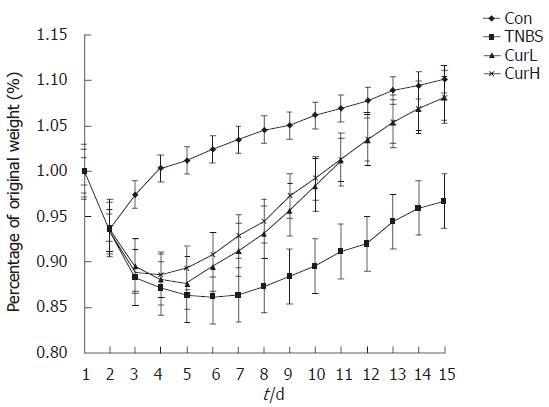
Figure 1 Body mass changes in rats with TNBS acid-induced colitis.
Each bar represents mean ± SE. P < 0.05 vs TNBS acid.
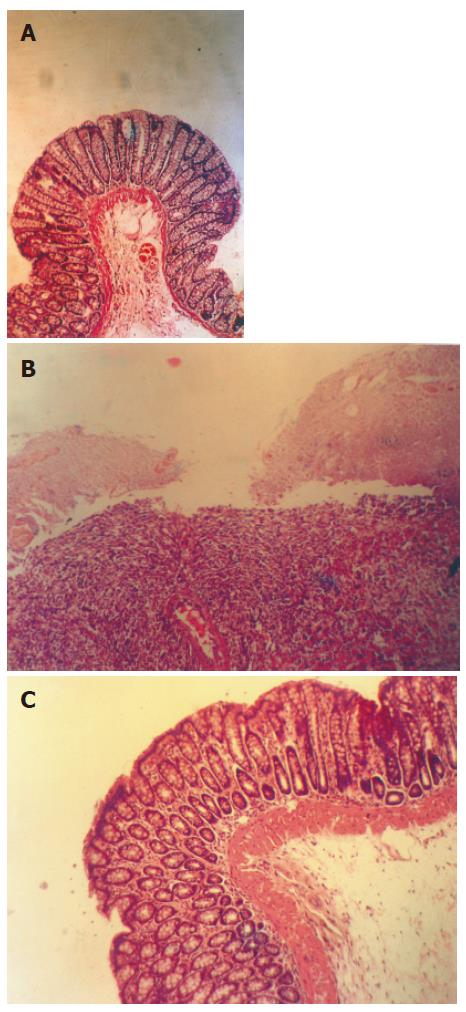
Figure 2 Effects of curcumin on histological scores of rats with TNBS acid-induced colitis in control group (A), TNBS acid group (B), and cur group (C).
(HE staining, original magnification: × 200).
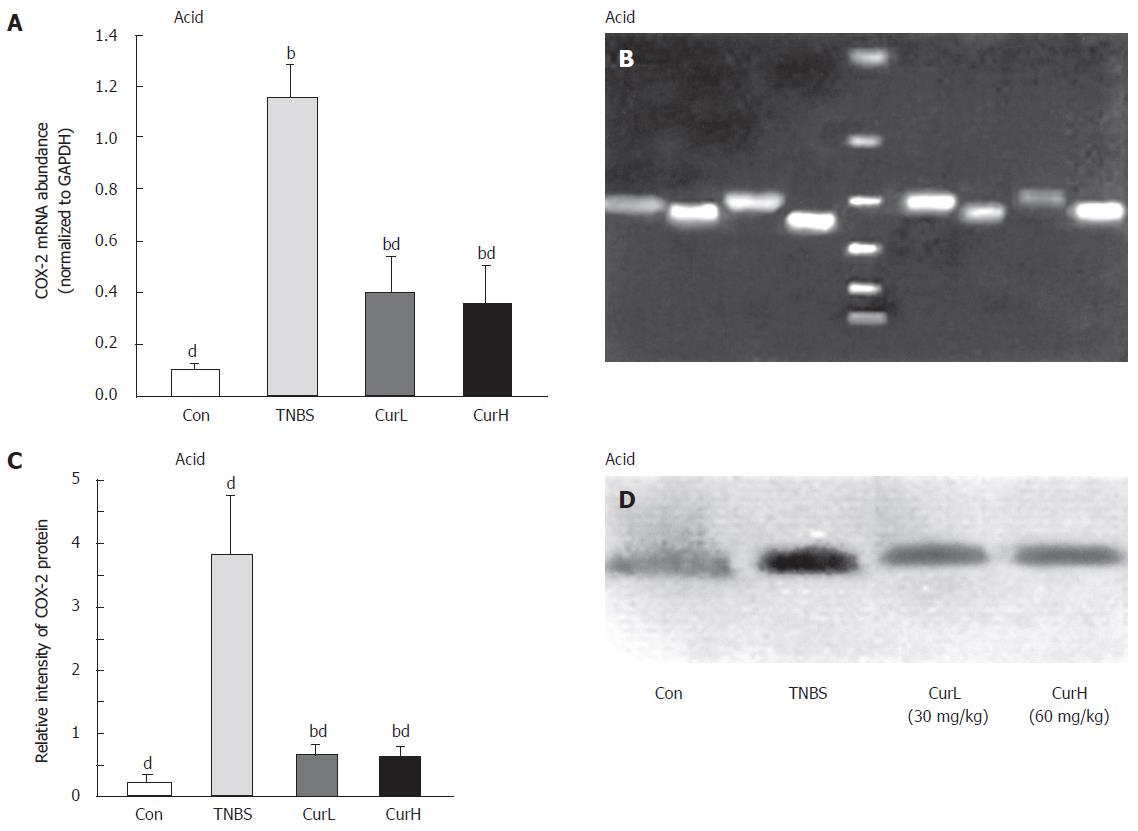
Figure 3 COX-2 expression in rats with TNBS acid-induced colitis.
A: COX-2 mRNA; B: COX-2 products; C and D: COX-2 protein (Mr72 000) (mean ± SE, Dunnett’s t test). bP < 0.01 vs control; dP < 0.01 vs TNBS acid.
- Citation: Jiang H, Deng CS, Zhang M, Xia J. Curcumin-attenuated trinitrobenzene sulphonic acid induces chronic colitis by inhibiting expression of cyclooxygenase-2. World J Gastroenterol 2006; 12(24): 3848-3853
- URL: https://www.wjgnet.com/1007-9327/full/v12/i24/3848.htm
- DOI: https://dx.doi.org/10.3748/wjg.v12.i24.3848


