Copyright
©2006 Baishideng Publishing Group Co.
World J Gastroenterol. Jun 21, 2006; 12(23): 3645-3650
Published online Jun 21, 2006. doi: 10.3748/wjg.v12.i23.3645
Published online Jun 21, 2006. doi: 10.3748/wjg.v12.i23.3645
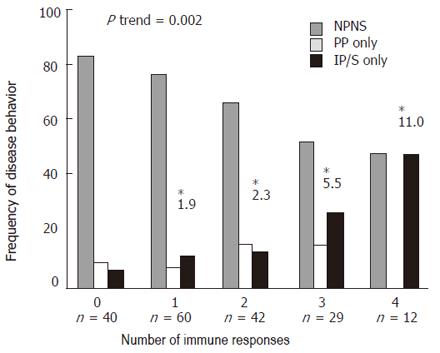
Figure 1 The frequency of disease behavior.
The test for trend demonstrated a positive linear trend in the frequency of patients with IP and/or S disease as the number of positive immune responses toward I2, OmpC, ASCA and CBir1 increased (P = 0.002). The odds ratios (OR) reflect the odds of having internal penetrating and/or stricturing disease when positive for any 1, combination of 2, 3 or all 4 immune responses, as compared to those patients negative for all immune responses (baseline group).
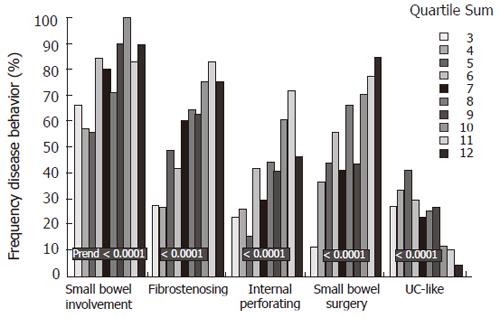
Figure 2 Association of the summed level of antibody responses towards multiple microbial antigens and disease phenotypes.
Quartile sums used to reflect lowest (3) to highest titer level (12) for ASCA, anti-I2 and anti-OmpC.
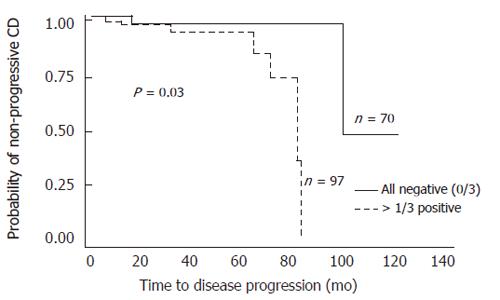
Figure 3 Kaplan Meier survival analysis.
Comparison of time to progression from non-complicating to complicating disease behaviors between patients positive for 1 immune response to ASCA, I2 and OmpC (n = 97) (—) and those negative for all 3 (n = 70) (----).
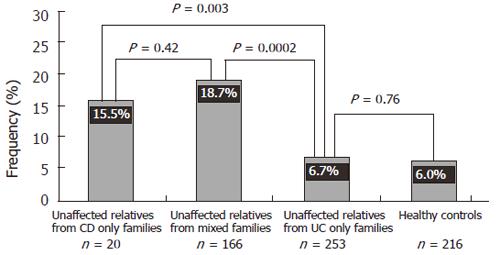
Figure 4 Frequency of anti-OmpC in unaffected relatives from CD only families, mixed families, UC only families, and healthy controls.
- Citation: Dubinsky MC, Taylor K, Targan SR, Rotter JI. Immunogenetic phenotypes in inflammatory bowel disease. World J Gastroenterol 2006; 12(23): 3645-3650
- URL: https://www.wjgnet.com/1007-9327/full/v12/i23/3645.htm
- DOI: https://dx.doi.org/10.3748/wjg.v12.i23.3645


