Copyright
©2006 Baishideng Publishing Group Co.
World J Gastroenterol. Jun 14, 2006; 12(22): 3585-3592
Published online Jun 14, 2006. doi: 10.3748/wjg.v12.i22.3585
Published online Jun 14, 2006. doi: 10.3748/wjg.v12.i22.3585
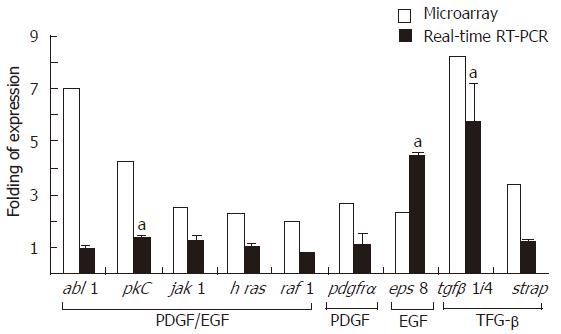
Figure 1 RT-PCR analysis of signal transduction genes up-regulation by O.
viverrini ES product. The results of DNA array and RT-PCR are shown in comparison for each gene (mean ± SD, aP < 0.05).
- Citation: Thuwajit C, Thuwajit P, Uchida K, Daorueang D, Kaewkes S, Wongkham S, Miwa M. Gene expression profiling defined pathways correlated with fibroblast cell proliferation induced by Opisthorchis viverrini excretory/secretory product. World J Gastroenterol 2006; 12(22): 3585-3592
- URL: https://www.wjgnet.com/1007-9327/full/v12/i22/3585.htm
- DOI: https://dx.doi.org/10.3748/wjg.v12.i22.3585


