Copyright
©2006 Baishideng Publishing Group Co.
World J Gastroenterol. Jun 7, 2006; 12(21): 3332-3337
Published online Jun 7, 2006. doi: 10.3748/wjg.v12.i21.3332
Published online Jun 7, 2006. doi: 10.3748/wjg.v12.i21.3332
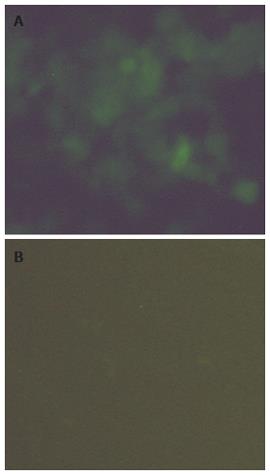
Figure 1 Stably transfected cells showing green fluorescence under a fluorescence microscope (A) and cells without stable expression of the transfected gene (B).
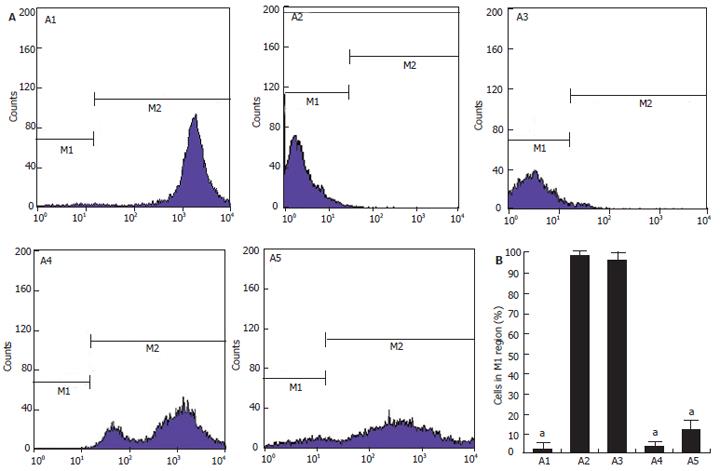
Figure 2 P-gp activity in HepG2 cells (A1), HepG2/ADM cells (A2), HepG2/ADM/vec control clone cells (A3); HepG2/ADM/pGenSil-l/MDR-B clone 1 cells (A4); HepG2/ADM/pGenSil-l /MDR-B clone 2 cells (A5) Rhodamine123 efflux was measured by counting cells in the M1 region of the plot.
The marker bar M1 was set to indicate the cells with high Rhodamine123 efflux; the marker bar M2 was set to indicate the cells with low rhodamine123 efflux. Data were presented as mean ± SD. aP < 0.05 vs untreated multidrug-resistant cell line HepG2/ADM.
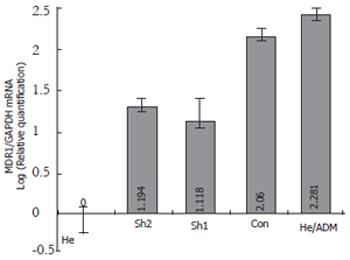
Figure 3 shRNA-mediated suppression of MDR1 mRNA.
He, sh1, sh2, con and He/ADM represent HepG2, HepG2/ADM/pGenSil-l/MDR-B clone 1, HepG2/ADM/pGenSil-l/MDR-B clone 2, HepG2/ADM/vec control clone and HepG2/ADM, respectively. The relative expression values were the mean of triplicate real-time PCR reactions. Bars indicate SE.
- Citation: Chen XP, Wang Q, Guan J, Huang ZY, Zhang WG, Zhang BX. Reversing multidrug resistance by RNA interference through the suppression of MDR1 gene in human hepatoma cells. World J Gastroenterol 2006; 12(21): 3332-3337
- URL: https://www.wjgnet.com/1007-9327/full/v12/i21/3332.htm
- DOI: https://dx.doi.org/10.3748/wjg.v12.i21.3332


