Copyright
©2006 Baishideng Publishing Group Co.
World J Gastroenterol. May 21, 2006; 12(19): 3092-3095
Published online May 21, 2006. doi: 10.3748/wjg.v12.i19.3092
Published online May 21, 2006. doi: 10.3748/wjg.v12.i19.3092
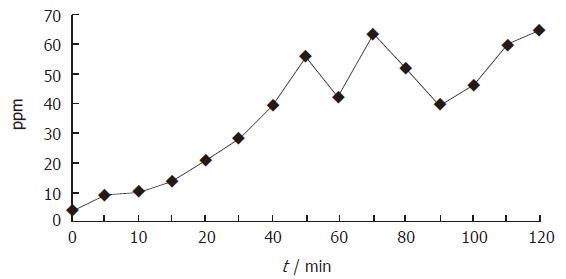
Figure 1 Changes in breath hydrogen concentration during OGTT in the patient with suspicious of small bowel bacterial overgrowth.
An increase of H2 greater than 10 ppm above the baseline was found at 15 min.
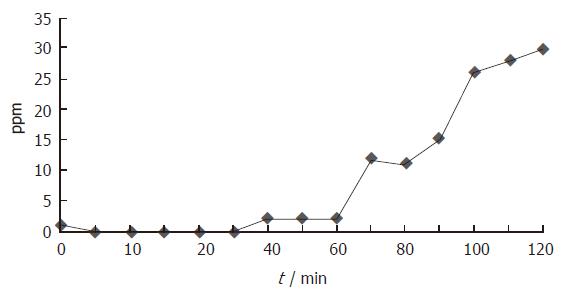
Figure 2 Changes in breath hydrogen concentration during OGTT in the patient with suspicious of carbohydrate malabsorption.
Breath H2 concentration increased gradually from the beginning and reached 10 ppm over the baseline at 70 min and later.
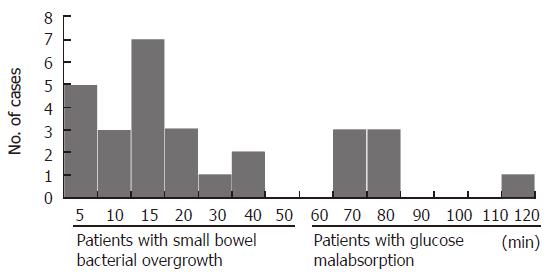
Figure 3 Distribution of time when breath hydrogen and/or methane levels increased more than 10 ppm over baseline.
- Citation: Urita Y, Ishihara S, Akimoto T, Kato H, Hara N, Honda Y, Nagai Y, Nakanishi K, Shimada N, Sugimoto M, Miki K. Seventy-five gram glucose tolerance test to assess carbohydrate malabsorption and small bowel bacterial overgrowth. World J Gastroenterol 2006; 12(19): 3092-3095
- URL: https://www.wjgnet.com/1007-9327/full/v12/i19/3092.htm
- DOI: https://dx.doi.org/10.3748/wjg.v12.i19.3092


