Copyright
©2006 Baishideng Publishing Group Co.
World J Gastroenterol. May 21, 2006; 12(19): 3050-3054
Published online May 21, 2006. doi: 10.3748/wjg.v12.i19.3050
Published online May 21, 2006. doi: 10.3748/wjg.v12.i19.3050
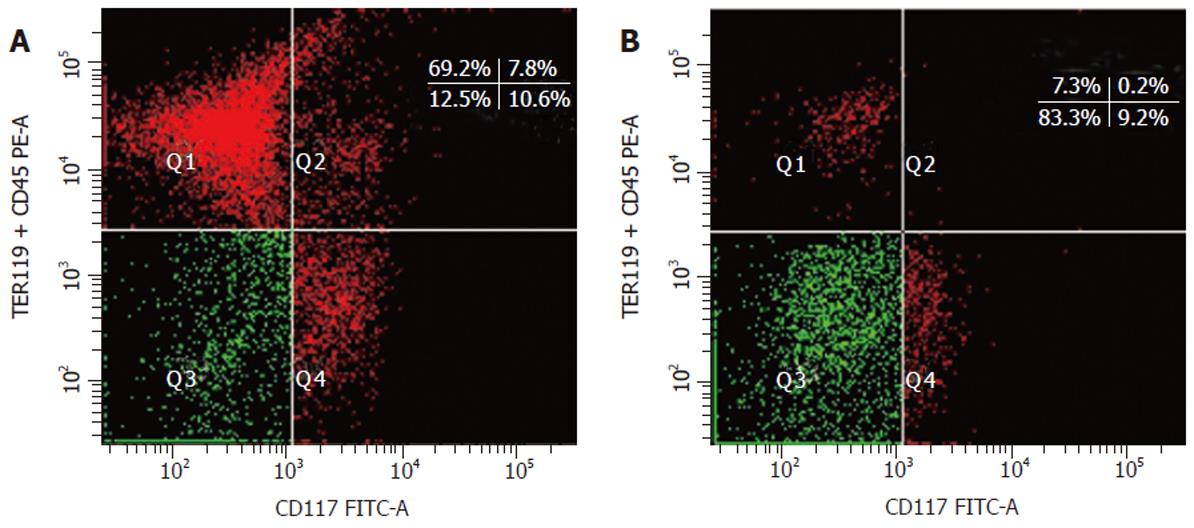
Figure 1 Flow cytometric fractionation and sorting of fetal mouse liver cells.
A: Two-color FACS analysis of ED 12 mouse fetal liver cells by FACSAria. A mixture of biotinylated anti-CD45.2 and anti-TER119 mAb versus FITC anti-CD117 mAb defined the four populations of the dot plot. B: Re-analysis of the sorted Q3 cells.
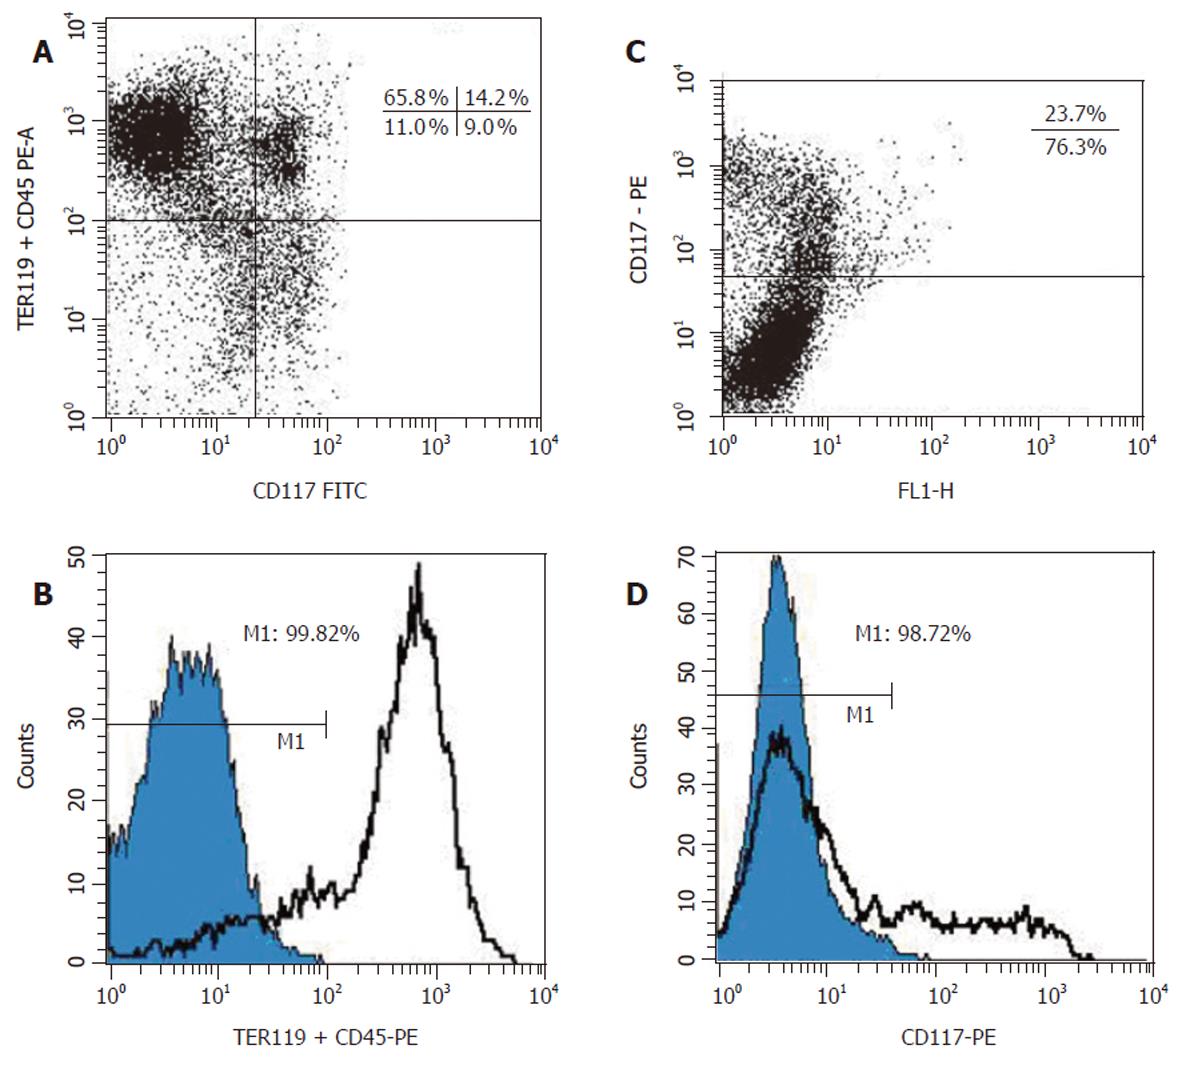
Figure 2 Flow cytometric analysis of fetal mouse liver cells before and after immuno-magnetic sorting.
A: Two-color FACS analysis of ED 13 mouse fetal liver cells by FACSCalibur. Cells were stained as described in Figure 1A. B: Histograms for the immuno-magnetically sorted (CD45/TER119)– cells labeled with phycoerythrin-streptavidin (blue) and the total cell populations before sorting (white). C: FACS analysis of ED 13 mouse fetal liver cells stained with the biotinylated anti-c-Kit mAb. D: Analysis of the immuno-magnetically sorted c-Kit– cells labeled with phycoerythrin-streptavidin (blue). The histogram of Figure 2B is also shown (white).
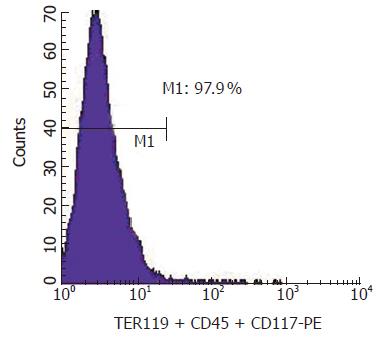
Figure 3 Analysis of the immuno-magne-tically sorted c-Kit– (CD45 / TER119)- cells.
After sorted, the nega-tive fraction was stained with phycoerythrin-streptavidin and analyzed by FACS.
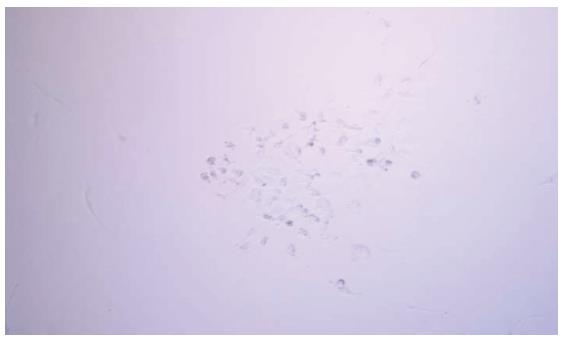
Figure 4 In vitro subcolony formation from the sorted c-Kit–(CD45/TER119)– cell.
Culture of c-Kit–(CD45/TER119)– cells was performed on laminin-coated 24-well plates for 4 d. Colonies were then digested and the cells from the formed clone were plated onto new culture plates and cultured for another 5 d. The picture shows a representative subcolony.
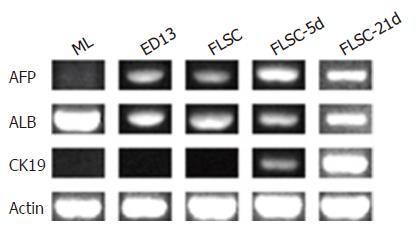
Figure 5 Hepato- and cholangiocyte- specific gene expressions of liver cells.
The mRNA was prepared and RT-PCRs were performed for the genes displayed in the figure in each cell subset. β-actin (Actin) gene expression was used as controls for mRNA content per sample. A representative experiment for all the gene expressions of a total of three independent ones is shown. ML, mature mouse liver cells; ED13, ED 13 mouse fetal liver cells; FLSC, fetal liver stem cells [c-Kit-(CD45/TER119)- cells]; FLSC-5d, FLSC cultured for 5 d; FLSC-21d, FLSC cultured for 21 d.
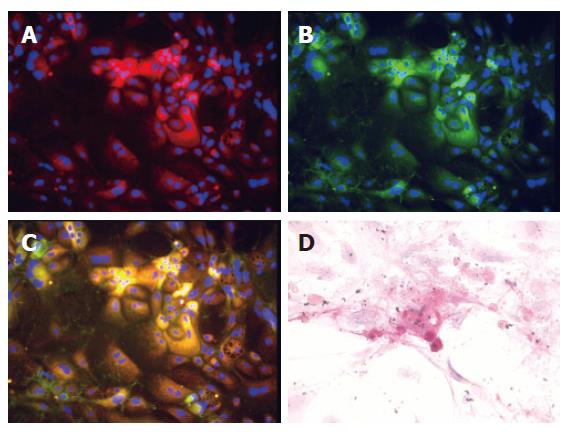
Figure 6 In vitro multilineage differentiation of ED 13 c-Kit–(CD45/TER119)– fetal liver cells.
The immunofluorescence pictures were obtained in 12-day cultures(A - C). Cells gave rise to albumin-positive hepatocytes (A, red) or cytokeratin 19-positive cholangiocytes (B, green). Also they gave rise to albumin and cytokeratin 19 double positive cells (yellow) and to double negative cells (C). The blue dots are DAPI nuclear signals. The original magnification was × 100. Intracellular glycogen was detected by periodic acid-Schiff staining(D). ED 13 c-Kit–(CD45/TER119)– fetal liver cells gave rise to functionally mature hepatocytes, containing abundant glycogen stores, after 21 d of culture. The original magnification was × 400.
- Citation: He YF, Liu YK, Gao DM, Chen J, Yang PY. An efficient method of sorting liver stem cells by using immuno-magnetic microbeads. World J Gastroenterol 2006; 12(19): 3050-3054
- URL: https://www.wjgnet.com/1007-9327/full/v12/i19/3050.htm
- DOI: https://dx.doi.org/10.3748/wjg.v12.i19.3050


