Copyright
©2006 Baishideng Publishing Group Co.
World J Gastroenterol. May 21, 2006; 12(19): 3015-3019
Published online May 21, 2006. doi: 10.3748/wjg.v12.i19.3015
Published online May 21, 2006. doi: 10.3748/wjg.v12.i19.3015
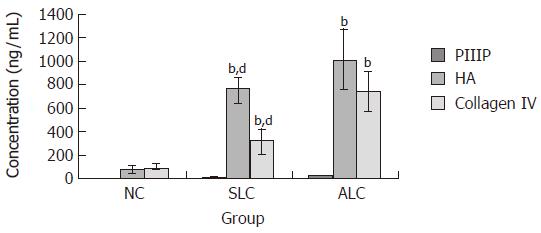
Figure 1 PIIIP, HA and type IV collagen levels in the three groups.
There was a statistically significant difference between ALC and NC (bP < 0.01, ALC vs NC) and ALC and SLC (dP < 0.01, ALC vs SLC).
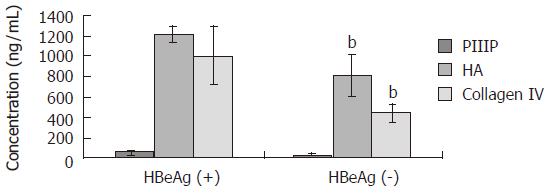
Figure 2 Relationship between serologic markers of fibrosis and HBeAg.
There were statistically significant differences in levels of serologic markers of fibrosis between HbeAg (+) and HbeAg (-) groups (bP < 0.01).
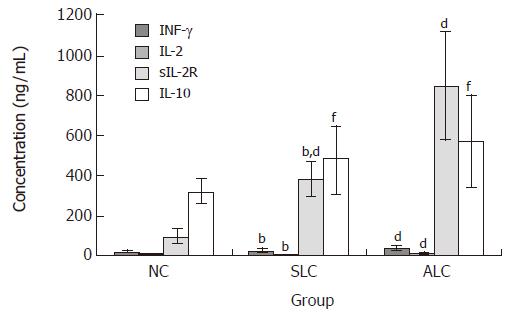
Figure 3 Serum IFN-γ, IL-2, sIL-2R and IL-10 levels in the three groups.
IFN-γ and IL-2 levels were significantly higher in the ALC group compared to the SLC and NC groups (bP < 0.01, ALC vs SLC; dP < 0.01, ALC vs NC), but no obvious difference was found between the SLC and NC groups (P > 0.05, NC vs SLC). IL-10 levels were significantly higher in the SLC group compared to the NC and ALC groups (fP < 0.01, SLC vs NC; P < 0.05, SLC vs ALC). sIL-2R levels elevated gradually in all three groups (bP < 0.01, ALC vs SLC; dP < 0.01, ALC vs NC; dP < 0.01, NC vs SLC).
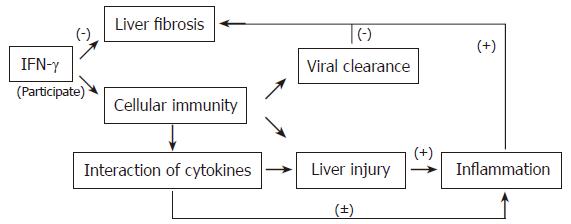
Figure 4 Simplified schemes showing the effects of IFN-γ on fibrosis.
(+): upregulate; (-): downregulate.
- Citation: Tang JT, Fang JY, Gu WQ, Li EL. T cell immune response is correlated with fibrosis and inflammatory activity in hepatitis B cirrhotics. World J Gastroenterol 2006; 12(19): 3015-3019
- URL: https://www.wjgnet.com/1007-9327/full/v12/i19/3015.htm
- DOI: https://dx.doi.org/10.3748/wjg.v12.i19.3015


