Copyright
©2006 Baishideng Publishing Group Co.
World J Gastroenterol. May 21, 2006; 12(19): 3006-3014
Published online May 21, 2006. doi: 10.3748/wjg.v12.i19.3006
Published online May 21, 2006. doi: 10.3748/wjg.v12.i19.3006
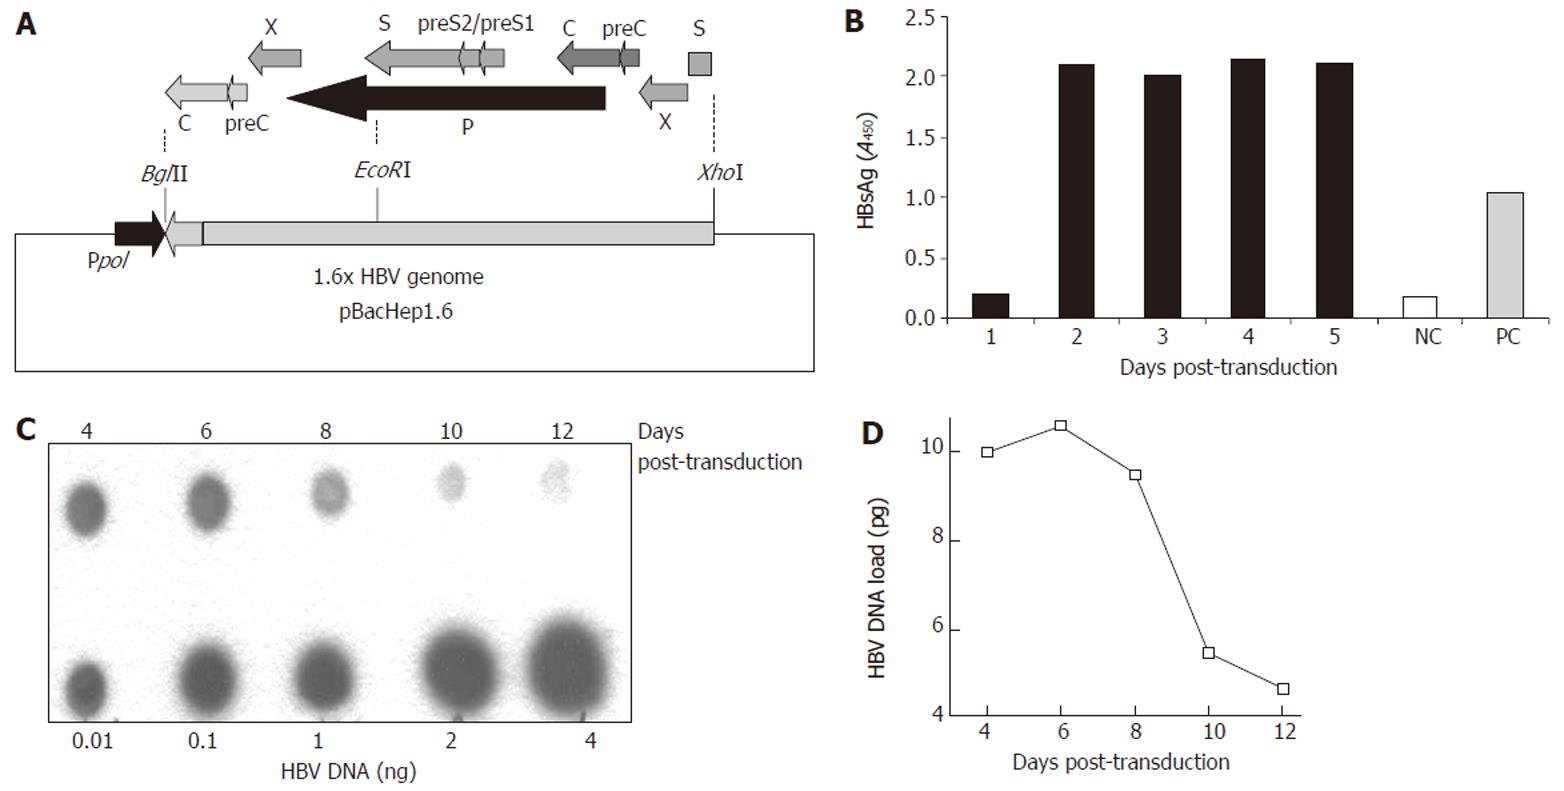
Figure 1 Construction of the recombinant Baculo-HBV virus (Bac-HBV).
A: The recombinant transfer vector, pBacHep1.6 (10.5 kb) together with the 1.6 × genome length HBV cloned in an orientation opposite to the polyhedrin promotor (pPol) in vector pBacPAK9. The construct contains HBV-ORFs: PreS/S (1x), X (2x), P (1x), PreC/C (2x) and Enh I (2x), Enh II (2x) elements; B: HBsAg expression in culture medium upon transduction with 100 moi of Bac-HBV; C: Dot blot analysis of total HBV DNA in HepG2 cells transduced with 100 moi of Bac-HBV. Different amounts of HBV DNA were used as quantitation standards, as indicated; D: Densitometric analysis and quantitative representation of the results shown in C.
Figure 2 A time course HBsAg profile (ELISA) of transduced HepG2 cells, treated with variable doses of lamivudine and IFN-γ.
A: Effect of lamivudine used at concentrations of 0.02, 0.2, and 2.0 μmol/L; B: Effect of IFN-γ used at concentrations of 0.1, 1.0 and 5.0 μg/L.
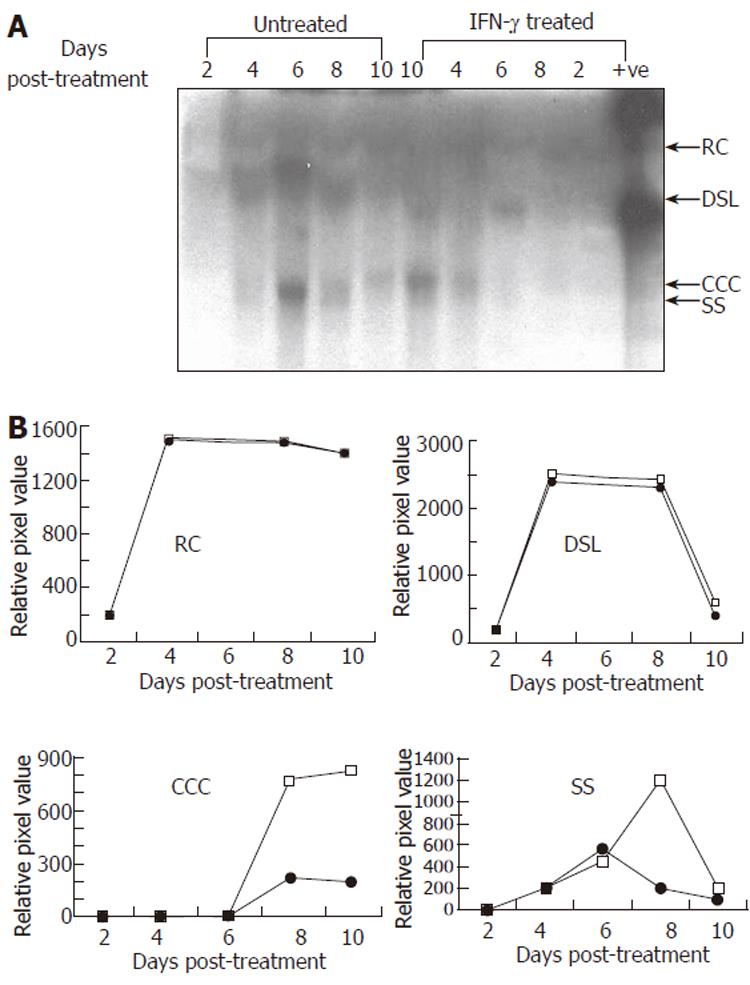
Figure 3 Representative Southern blot (A) and quantitative (densitometry) analysis (B) of effect of IFN-γ (5.
0 μg/L) treatment on HBV DNA replication in transduced HepG2 cells. Synthesis of viral replicative intermediates: relaxed coil (RC), double stranded linear (DSL), covalently closed circular (CCC), and single stranded (SS) DNA forms in treated (•) and untreated (□) cells.
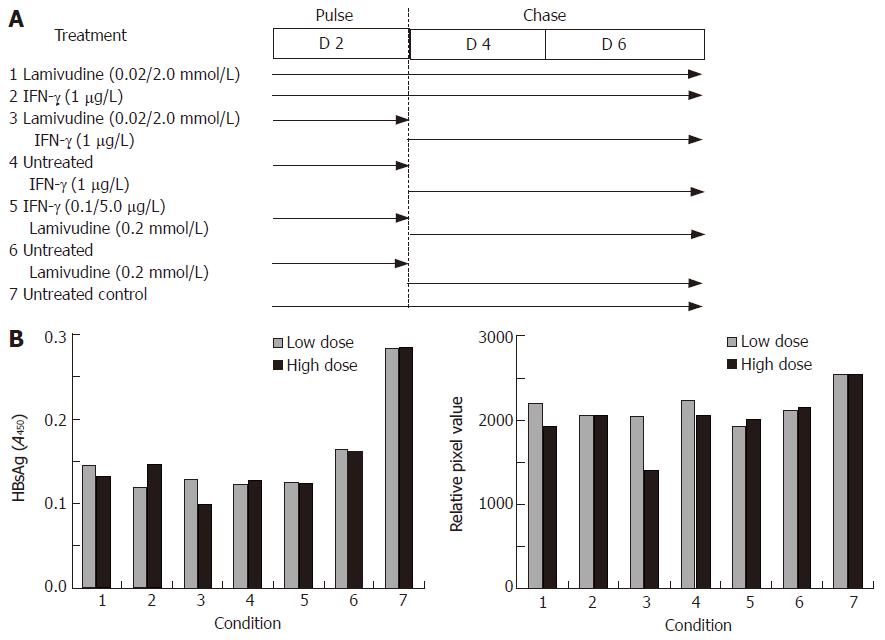
Figure 4 Effects of sequential treatment with “low/high-dose” of lamivudine and IFN-γ on HBV gene expression and total DNA load in transduced HepG2 cells.
A: HBsAg profile; B: total HBV DNA upon sequential treatment of transduced cells. 1: Lamivudine (0.02 or 2.0 μmol/L) 6 d; 2: IFN-γ (1.0 μg/L) 6 d; 3: Lamivudine (0.02 or 2.0 μmol/L) 2 d + IFN-γ (1 μg/L) 4 d; 4: Untreated 2 d + IFN-γ (1.0 μg/L) 4 d; 5: IFN-γ (0.1 or 5 μg/L) 2 d + lamivudine (0.2 μmol/L) 4 d; 6: Untreated 2 d + lamivudine (0.2 μmol/L) 4 d; 7: Untreated control.
Figure 5 Effects of sequential treatment with “high-dose” of lamivudine and IFN-γ (A) on HBeAg expression in transduced HepG2 cells (B).
1: Lamivudine (2.0 μmol/L) 6 d; 2: IFN-γ (5.0 μg/L) 6 d; 3: Lamivudine (0.2 μmol/L) 2 d + IFN-γ (5 μg/L) 4 d; 4: Untreated 2 d + IFN-γ (5 μg/L) 4 d; 5: Lamivudine (0.2 μmol/L) 2 d and untreated 4 d; 6: Untreated control.
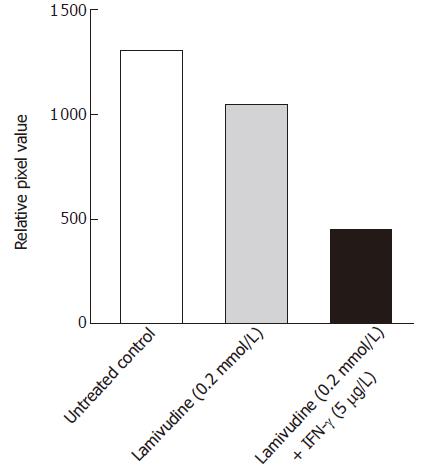
Figure 6 Effect of sequential treatment with “high-dose” of Lamivudine and IFN-γon HBV cccDNA pool in transduced HepG2 cells.
The figure shows densitometric analysis of the 2 kb cccDNA form. 1: Untreated control; 2: Lamivudine (0.2 μmol/L) 8 d; 3: Lamivudine (0.2 μmol/L) 2 d + IFN-γ (5.0 μg/L) 6 d.
- Citation: Parvez MK, Sehgal D, Sarin SK, Basir SF, Jameel S. Inhibition of hepatitis B virus DNA replicative intermediate forms by recombinant interferon-γ. World J Gastroenterol 2006; 12(19): 3006-3014
- URL: https://www.wjgnet.com/1007-9327/full/v12/i19/3006.htm
- DOI: https://dx.doi.org/10.3748/wjg.v12.i19.3006


