Copyright
©2006 Baishideng Publishing Group Co.
World J Gastroenterol. May 21, 2006; 12(19): 3000-3005
Published online May 21, 2006. doi: 10.3748/wjg.v12.i19.3000
Published online May 21, 2006. doi: 10.3748/wjg.v12.i19.3000
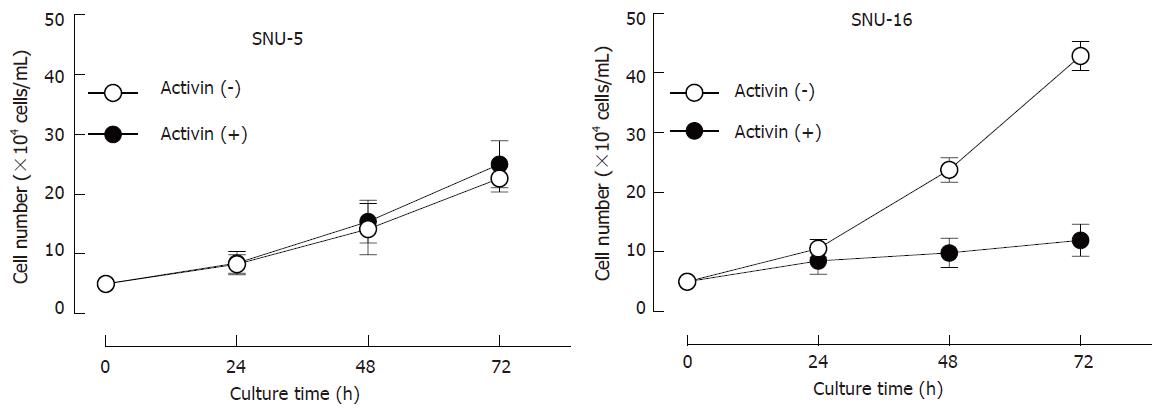
Figure 1 Effects of activin A on cell viability in SNU-5 and SNU-16 cells.
Cells (5 × 10⁴ cells/mL) were cultured with activin A (100 ng/mL) in a time-dependent manner and viable cells were counted with a hemocytometer. Values are the mean ± SD of three individual experiments. bP < 0.01 vs the control values.
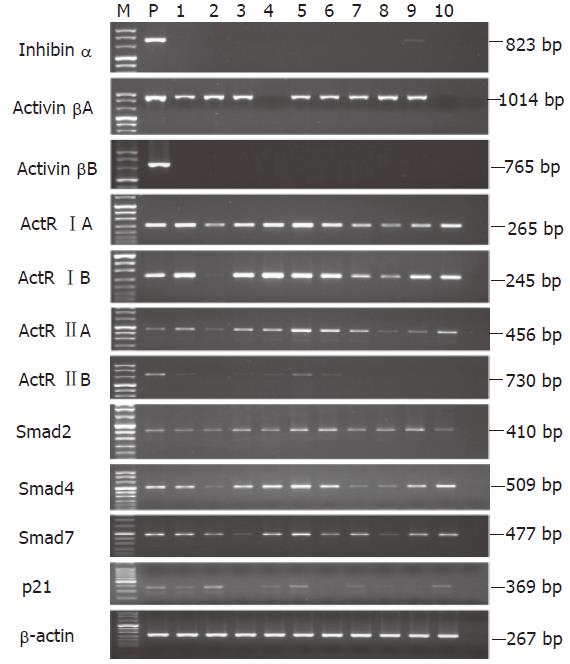
Figure 2 mRNA expressions of inhibin/activin subunits, activin receptors, Smads, and p21CIP1/WAF1 in human gastric cancer cell lines.
The mRNA levels were analyzed by RT-PCR. M: DNA size marker; P: positive control; lane 1: AGS; lane 2: KATO III; lane 3: SNU-1; lane 4: SNU-5; lane 5: SNU-16; lane 6: SNU-484; lane 7: SNU-601; lane 8: SNU-638; lane 9: SNU-668; lane 10: SNU-719. Positive control was used for inhibin/activin subunits (mouse ovary), activin receptor (K562), Smad and p21CIP1/WAF1 (human keratinocytes) respectively.
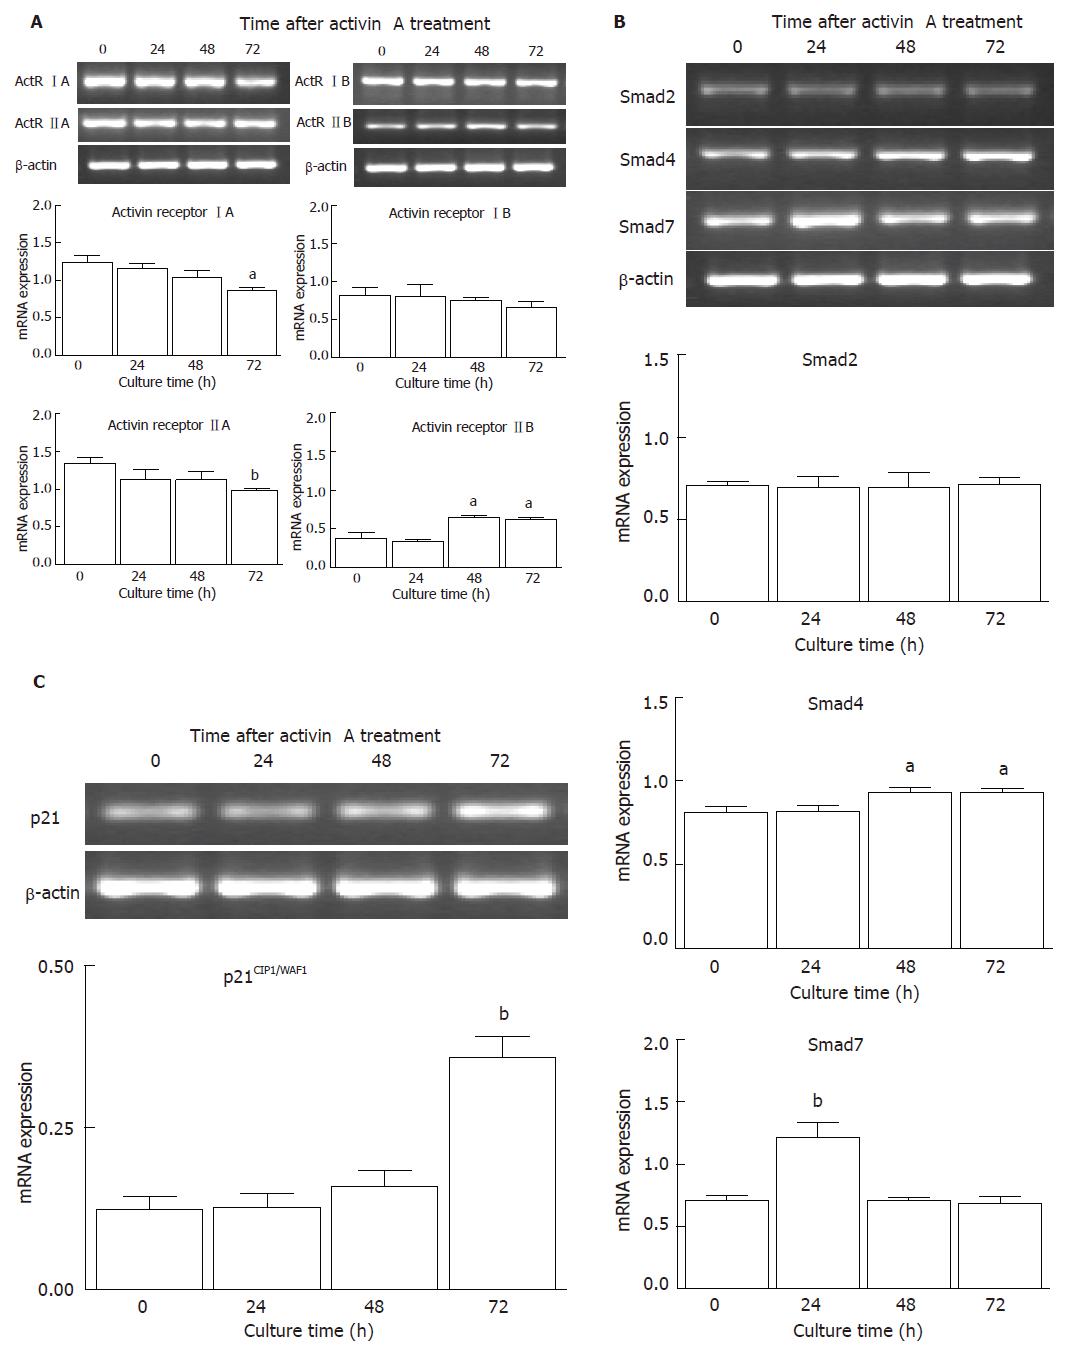
Figure 3 Effects of activin A on activin receptor mRNA expression (A), smad mRNA expression (B), and p21CIP1/WAF1 mRNA expression (C) in SNU-16 cells.
Cells (5 × 10⁴ cells/mL) were cultured with activin A (100 ng/mL) in a time-dependent manner and mRNA levels were measured by RT-PCR. Values are mean ± SD of three individual experiments and reported as the ratio of activin receptors to β-actin signals, the ratio of Smad to β-actin signals, and the ratio of p21CIP1/WAF1 to β-actin signals, respectively. aP < 0.05 and bP < 0.01 vs the control values.
- Citation: Kim YI, Lee HJ, Khang I, Cho BN, Lee HK. Selective inhibition of cell growth by activin in SNU-16 cells. World J Gastroenterol 2006; 12(19): 3000-3005
- URL: https://www.wjgnet.com/1007-9327/full/v12/i19/3000.htm
- DOI: https://dx.doi.org/10.3748/wjg.v12.i19.3000


