Copyright
©2006 Baishideng Publishing Group Co.
World J Gastroenterol. May 21, 2006; 12(19): 2969-2978
Published online May 21, 2006. doi: 10.3748/wjg.v12.i19.2969
Published online May 21, 2006. doi: 10.3748/wjg.v12.i19.2969
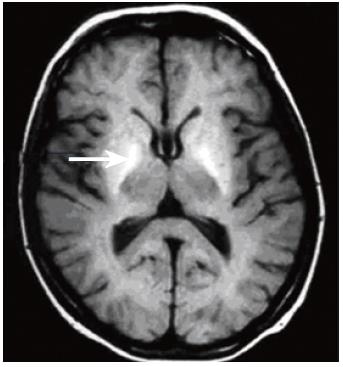
Figure 1 T1-weighted brain MR image through the basal ganglia acquired at 1.
5T, showing bilateral globus pallidus (arrow) hyperintensity in a patient with cirrhosis of the liver.
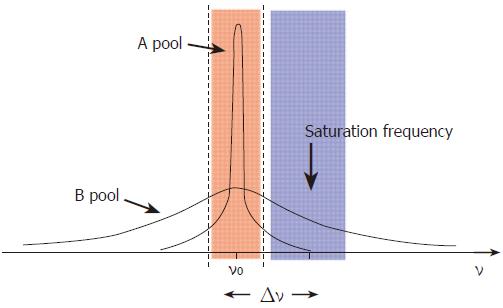
Figure 2 Model demonstrating the concepts underlying the phenomenon of magnetization transfer.
The free pool of protons (A) resonates at the Larmor frequency (ν0) and has a narrow spectral line. It is excited by an RF pulse which covers the frequencies shown in pink. The “bound” pool of protons (B) has a broad spectral line and can be excited and saturated by the application of RF irradiation at a frequency offset by Δν, shown in blue, without significantly affecting pool A.
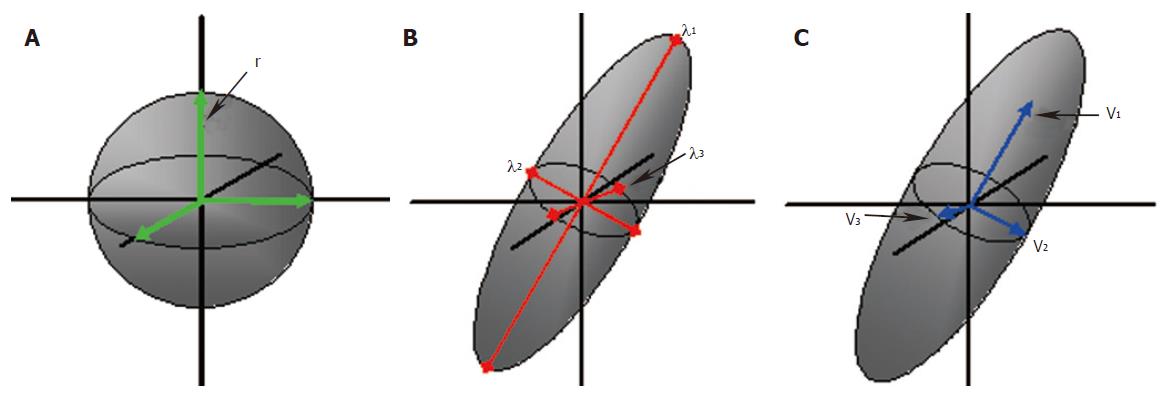
Figure 3 Principles of diffusion: A water molecule in an unconstrained environment would move randomly and equally in all directions; isotropic diffusion (A).
The probability of motion can be defined by the radius ‘r’, of the spherical range of motion. Diffusion in an ordered environment such as the white matter will assume an elliptical range of motion (B and C). Three eigenvalues, λ1, λ2 and λ3 define the shape and three eigenvectors v1, v2 and v3 define the orientation of the ellipsoid.
Figure 4 Color fractional anisotropy (FA) image from a 44 year-old healthy male volunteer.
Diffusion tensor imaging (DTI) performed on a 3T Philips InteraTM using 32 different directions of diffusion sensitization. The different colors represent the principle diffusion directions and hence the direction of the white matter tracts: green represents anterior-posterior, blue represents caudo-cranial, red represents transverse. FA maps were generated using DTI studio version 2.1©, (Jiang and Mori, Johns Hopkins University, MD, USA).
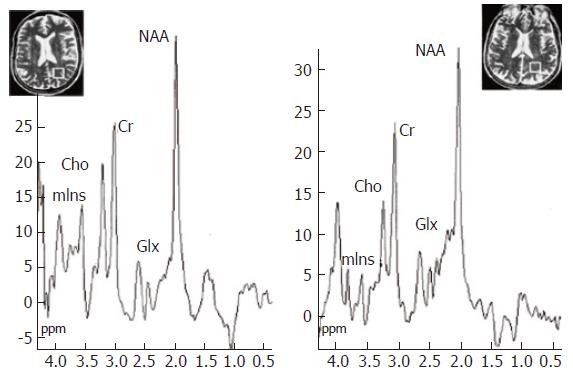
Figure 5 1H MR spectroscopy water-suppressed proton spectra of an 8 mL voxel located in the parietal region including predominantly normal appearing white matter (insert images show position of the voxel) in a healthy control subject (left) and in a cirrhotic patient (right), acquired using a STEAM pulse sequence [1600/20/30/256 (TR/TE/TM/acquisitions)].
The main resonances correspond to N-acetylaspartate (NAA, 2.0 ppm), glutamate/glutamine (Glx, 2.1-2.5 ppm), creatine/phosphocreatine (Cr, 3.02 ppm), choline-containing compounds (Cho, 3.2 ppm), and myo-Inositol (mIns, 3.55 ppm). Comparison of the spectra shows a decrease in Cho and mIns resonances with an increase in the glutamate/glutamine region in the cirrhotic patient. Reproduced with the permission of Springer Science and Business Media, from Cordoba et al 2002[28].
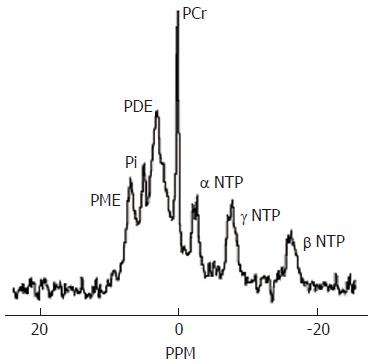
Figure 6 Normal brain phosphorus-31 MR spectrum acquired at 1.
5T. PME = phosphomonoesters, Pi=inorganic phosphate, PDE = phosphodiesters, PCr = phosphocreatine, NTP = nucleotide triphosphate. The PME resonance provides information on cell membrane precursors and the PDE resonance on cell membrane degradation products.
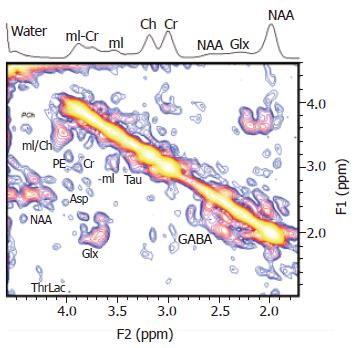
Figure 7 A localized two-dimensional correlated spectroscopy (two-dimensional L-COSY) spectrum of a 40-year-old patient.
A projected one-dimensional spectrum is also shown on top of the figure. Peaks are presented in the magnitude mode. Reproduced with permission from John Wiley and Sons Inc, from Binesh N et al 2005[92].
- Citation: Grover VB, Dresner MA, Forton DM, Counsell S, Larkman DJ, Patel N, Thomas HC, Taylor-Robinson SD. Current and future applications of magnetic resonance imaging and spectroscopy of the brain in hepatic encephalopathy. World J Gastroenterol 2006; 12(19): 2969-2978
- URL: https://www.wjgnet.com/1007-9327/full/v12/i19/2969.htm
- DOI: https://dx.doi.org/10.3748/wjg.v12.i19.2969


