Copyright
©2006 Baishideng Publishing Group Co.
World J Gastroenterol. May 14, 2006; 12(18): 2895-2900
Published online May 14, 2006. doi: 10.3748/wjg.v12.i18.2895
Published online May 14, 2006. doi: 10.3748/wjg.v12.i18.2895
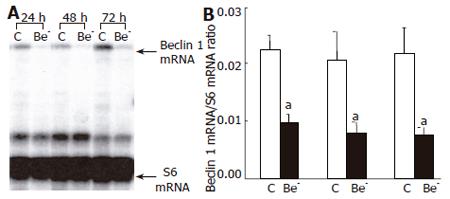
Figure 1 Beclin 1 mRNA expression after transfection of HepG2 cells with a Beclin 1 siRNA or a control siRNA.
A: Representative RPA gel; B: Quantification of the Beclin1/S6 mRNA ratio. Results are means ± SE for 4 experiments (aP < 0.05 vs C).
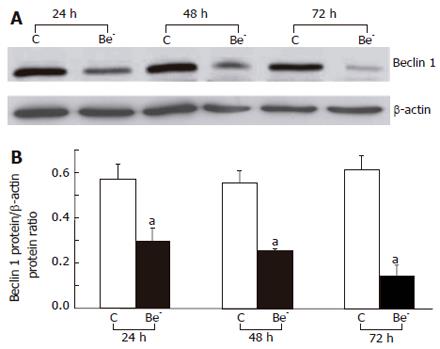
Figure 2 Beclin 1 protein expression after transfection of HepG2 cells with a Beclin 1 siRNA or a control siRNA.
A: Representative Western blot of Beclin 1 and β-actin; B: Quantification of the Beclin 1 protein normalized to β-actin. Data are means ± SE for three experiments (aP < 0.05 vs C).
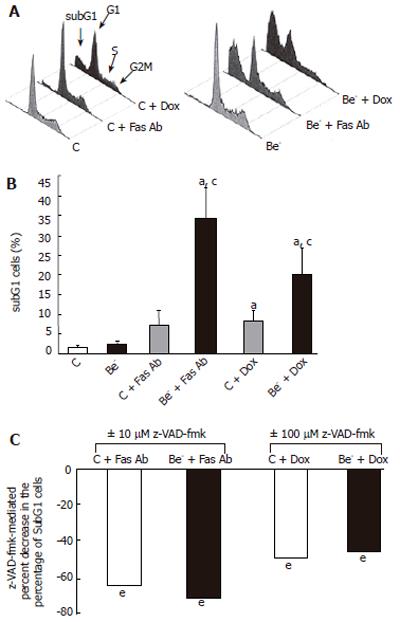
Figure 3 Percentage of subG1 cells after treatment of siRNA-transfected HepG2 cells with an agonistic anti-Fas antibody or doxorubicin.
A: Representative flow cytometry analysis of the cell cycle; B: Quantification of the subG1 peak. Results are means ± SE for 5 to 8 experiments (aP < 0.05 vs untreated cells; cP < 0.05 vs cells transfected with the control siRNA); C: Effects of z-VAD-fmk. The figure shows the mean percent decrease in subG1 cells for 3 to 5 experiments (eP < 0.05 between cells incubated with and without z-VAD-fmk).
Figure 4 Western blot analysis of PARP cleavage after treatment of siRNA-transfected HepG2 cells with an agonistic anti-Fas antibody or doxorubicin.
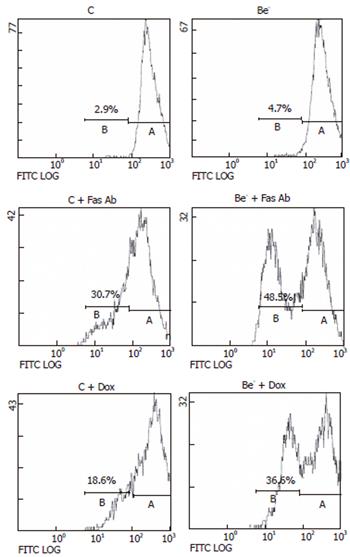
Figure 5 Assessment of the mitochondrial membrane potential in HepG2 living cells after siRNA transfection and treatment with an agonistic anti-Fas antibody or doxorubicin (Dox).
In four to five different experiments, the percentage (mean ± SE) of cells with a low mitochondrial membrane potential was 4.5 ± 1.3% in C cells, 7.7 ± 2.9% in the Be- cells, 29.1 ± 4.9% in C cells treated with the Fas Ab, 52.5 ± 7.1% in Be- cells treated with the Fas Ab (P < 0.05 vs treated C cells), 23.6 ± 3% in C cells treated with Dox, and 38.8 ± 3.8% in Be- cells treated with Dox (P < 0.05 vs treated C cells).
Figure 6 Assessment of cytochrome c release in HepG2 cells after siRNA transfection and treatment with an agonistic anti-Fas antibody or doxorubicin.
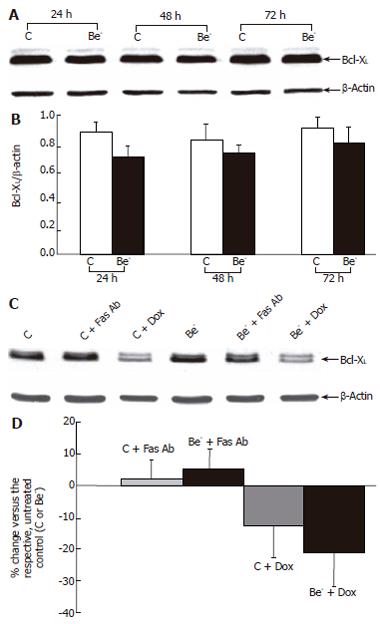
Figure 7 Expression of the Bcl-XL protein after siRNA transfection, and treatment with an agonistic anti-Fas antibody or doxorubicin (Dox).
A: Representative Western blot of Bcl-XL and β-actin; B: Quantification of the Bcl-XL/β-actin ratio (mean ± SE for 5 experiments); C: Representative Western blot of Bcl-XL and β-actin after incubation with or without Dox or an anti-Fas; D: Quantification of the Fas Ab- or Dox-induced change in Bcl-XL expression (means ± SE for 4 to 5 experiments).
- Citation: Daniel F, Legrand A, Pessayre D, Vadrot N, Descatoire V, Bernuau D. Partial Beclin 1 silencing aggravates doxorubicin- and Fas-induced apoptosis in HepG2 cells. World J Gastroenterol 2006; 12(18): 2895-2900
- URL: https://www.wjgnet.com/1007-9327/full/v12/i18/2895.htm
- DOI: https://dx.doi.org/10.3748/wjg.v12.i18.2895


