Copyright
©2006 Baishideng Publishing Group Co.
World J Gastroenterol. Apr 14, 2006; 12(14): 2276-2279
Published online Apr 14, 2006. doi: 10.3748/wjg.v12.i14.2276
Published online Apr 14, 2006. doi: 10.3748/wjg.v12.i14.2276
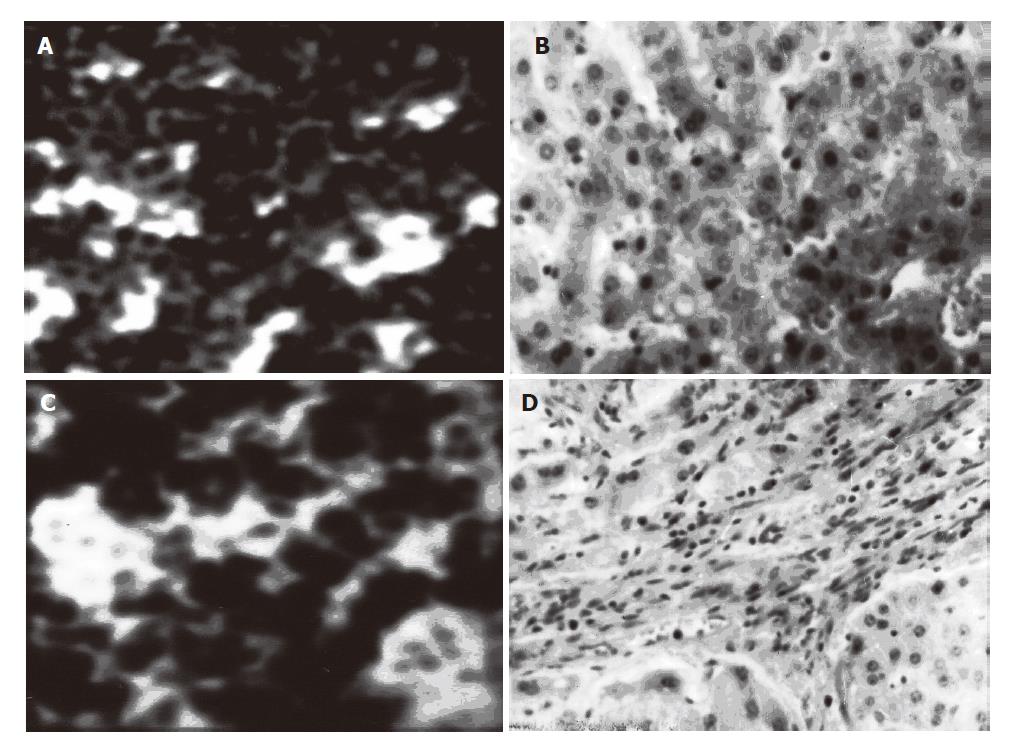
Figure 1 Ultras-ound images of normal and cirr-hotic liver and their corresponding pa-thological slices A: ultrasound imaging of normal liver; B: pathological slice of normal liver; C:ultrasound imaging of cirrhotic liver; D: pathological slice of cirrhotic liver.
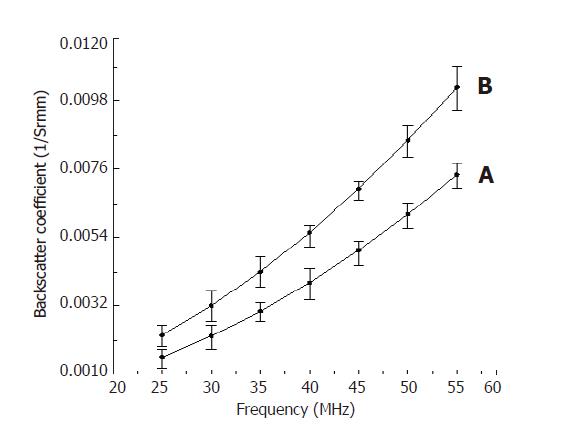
Figure 2 Backscatter coefficients changing with frequency in normal liver (A) and cirrhotic liver (B).
- Citation: Liu XZ, Gong XF, Zhang D, Ye SG, Rui B. Ultrasonic characterization of porcine liver tissue at frequency between 25 to 55 MHz. World J Gastroenterol 2006; 12(14): 2276-2279
- URL: https://www.wjgnet.com/1007-9327/full/v12/i14/2276.htm
- DOI: https://dx.doi.org/10.3748/wjg.v12.i14.2276


