Copyright
©2006 Baishideng Publishing Group Co.
World J Gastroenterol. Apr 14, 2006; 12(14): 2181-2186
Published online Apr 14, 2006. doi: 10.3748/wjg.v12.i14.2181
Published online Apr 14, 2006. doi: 10.3748/wjg.v12.i14.2181
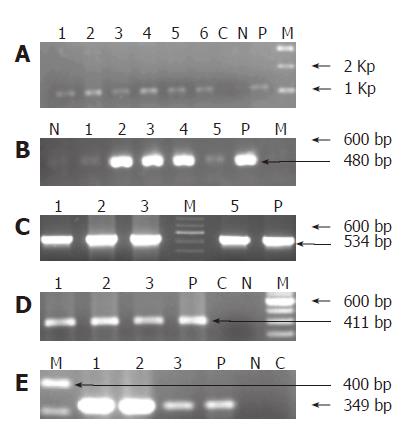
Figure 1 A schematic representation of the PCR products of the Helicobacter spp DNA.
A: Gel image showing first amplification products of 16S rRNA PCR with Helicobacter genus specific primers at 1 300 bp. Lanes 1 to 6 represent Helicobacter DNA isolated from bile samples, ‘P’ represents positive control andLanes C, N and M represents negative control, reaction negative control and 1 Kb molecular weight marker. B: Second amplification products of 16S rRNA PCR with Helicobacter genus specific primers at 480 bp. Lanes 1 to 5 represent bile DNA, ‘P’ represents positive control. Lanes N and M represent reaction negative control and 100 bp molecular weight marker ladder respectively. C: Gel picture showing 16S rRNA amplification products specific to H pylori of bile samples at 534 bp. Lanes 1, 2, 3 and 5 represent bile DNA samples while Lanes M and P represent 100 bp ladder and positive control respectively. D: ureA amplification products at 411 bp. Lanes 1 to 3 represent bile DNA, Lane ‘P’ represents positive control and Lanes C, N and M represent negative control, reaction negative control and 100bp molecular weight ladder respectively. E: Gel picture illustrating the cagA amplification products at 349 bp. Lanes 1, 2 and 3 represent bile DNA while Lanes M, P, N and C represent 100bp molecular weight ladder, positive and reaction negative control, negative control respectively.
- Citation: Tiwari SK, Khan AA, Ibrahim M, Habeeb MA, Habibullah CM. Helicobacter pylori and other Helicobacter species DNA in human bile samples from patients with various hepato-biliary diseases. World J Gastroenterol 2006; 12(14): 2181-2186
- URL: https://www.wjgnet.com/1007-9327/full/v12/i14/2181.htm
- DOI: https://dx.doi.org/10.3748/wjg.v12.i14.2181


