Copyright
©2006 Baishideng Publishing Group Co.
World J Gastroenterol. Mar 28, 2006; 12(12): 1918-1923
Published online Mar 28, 2006. doi: 10.3748/wjg.v12.i12.1918
Published online Mar 28, 2006. doi: 10.3748/wjg.v12.i12.1918
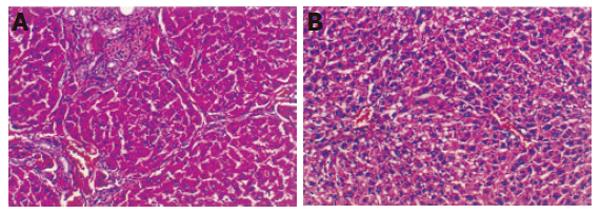
Figure 1 Liver of rats in groups C (A) and I (B) (week 11, H-E staining, ×100)
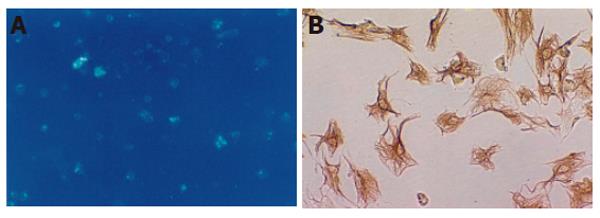
Figure 2 Autofluorescence (A) and desmin staining (B) of HSCs.
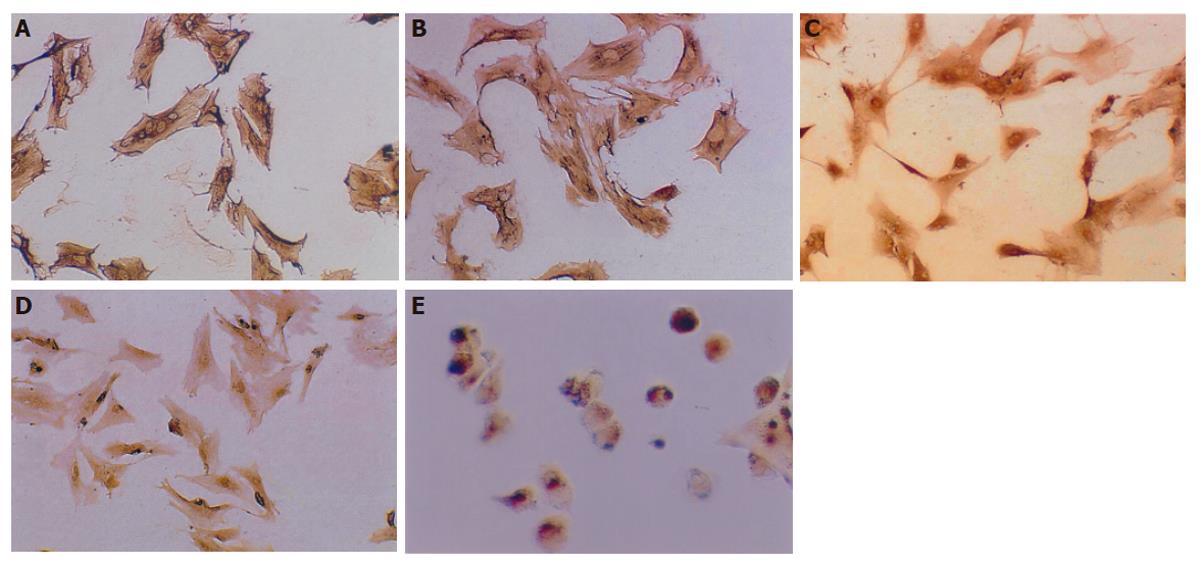
Figure 3 α-SMA in HSCs of group C (A) in week 11 and group I (B) in week 7; NF-κB in HSCs of group C (C) in week 11 and group I (D) in week 7; and changes of HSCs in group I (E) in week 11.
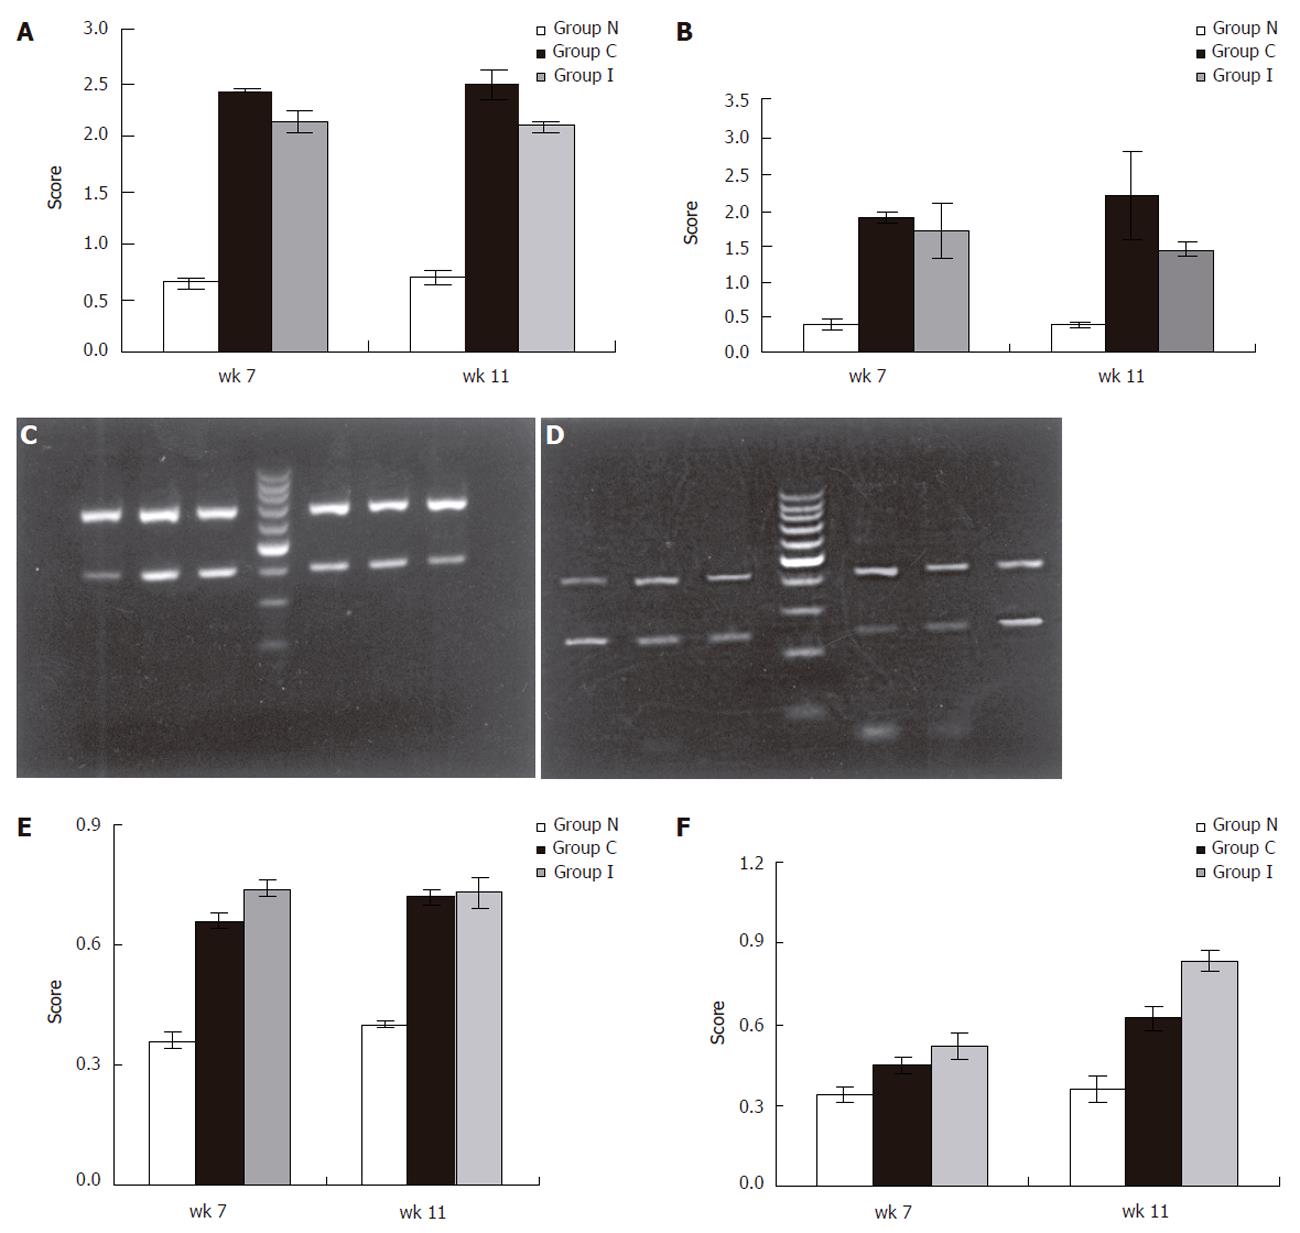
Figure 4 Expressions of α-SMA (A), NF-κB (B), Fas mRNA (C), FasL mRNA (D), Fas (E), and FasL (F) in HSCs.
- Citation: Zhang LJ, Zheng WD, Shi MN, Wang XZ. Effects of interleukin-10 on activation and apoptosis of hepatic stellate cells in fibrotic rat liver. World J Gastroenterol 2006; 12(12): 1918-1923
- URL: https://www.wjgnet.com/1007-9327/full/v12/i12/1918.htm
- DOI: https://dx.doi.org/10.3748/wjg.v12.i12.1918


