Copyright
©2006 Baishideng Publishing Group Co.
World J Gastroenterol. Mar 21, 2006; 12(11): 1766-1769
Published online Mar 21, 2006. doi: 10.3748/wjg.v12.i11.1766
Published online Mar 21, 2006. doi: 10.3748/wjg.v12.i11.1766
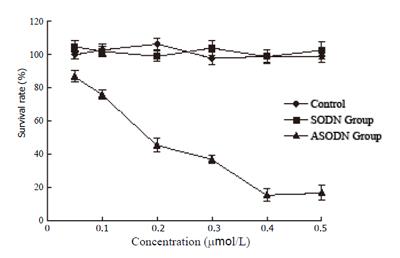
Figure 1 Dose-response curves of SGC7901 cell lines.
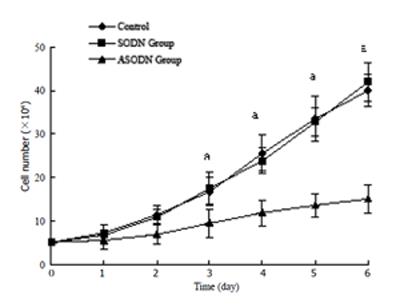
Figure 2 Growth curves of SGC7901 cell lines.
aP<0.05 vs control.
Figure 3 Effect of Cyclin D1 ASODN on chemosensitivity in SGC7901 cells.
A: 5-FU; B: MTX; C: CDDP.
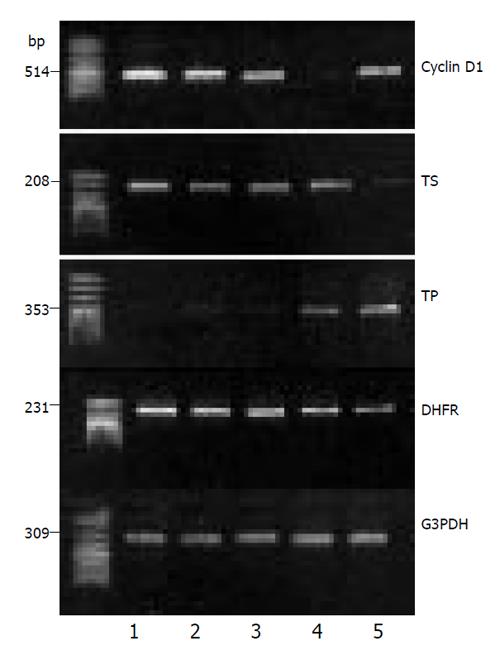
Figure 4 Effect of Cyclin D1 ASODN on mRNA expression of Cyclin D1, TS, TP and DHFR.
1, the Control; 2, SODN group at 24 h; 3, SODN group at 48 h; 4, ASODN group at 24 h; 5, ASODN group at 48 h.
- Citation: Shuai XM, Han GX, Wang GB, Chen JH. Cyclin D1 antisense oligodexoyneucleotides inhibits growth and enhances chemosensitivity in gastric carcinoma cells. World J Gastroenterol 2006; 12(11): 1766-1769
- URL: https://www.wjgnet.com/1007-9327/full/v12/i11/1766.htm
- DOI: https://dx.doi.org/10.3748/wjg.v12.i11.1766


