Copyright
©2006 Baishideng Publishing Group Co.
World J Gastroenterol. Mar 21, 2006; 12(11): 1730-1738
Published online Mar 21, 2006. doi: 10.3748/wjg.v12.i11.1730
Published online Mar 21, 2006. doi: 10.3748/wjg.v12.i11.1730
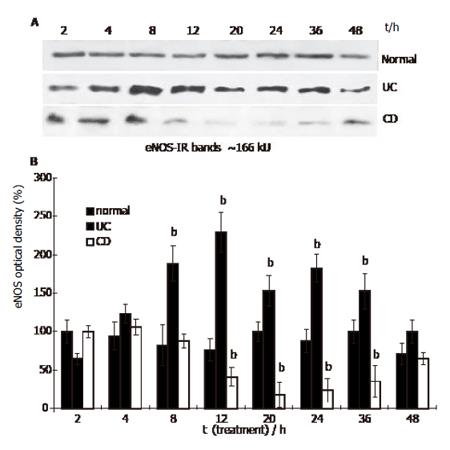
Figure 1 eNOS content in HUVEC treated with IBD sera (Western blot.
Mean ± SE, n = 3; bP<0.01 vs normal).
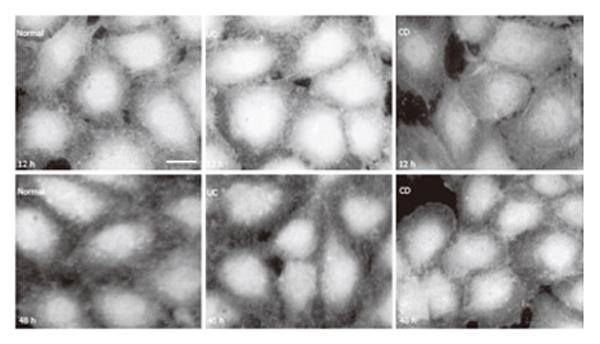
Figure 2 eNOS in HUVEC (immunoreaction was visualized by FITC.
bar: 10 µm).
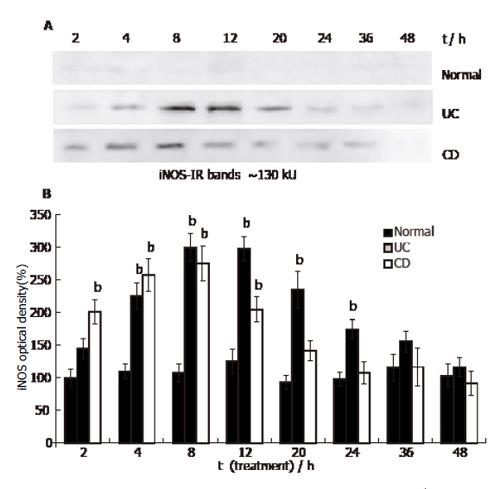
Figure 3 iNOS content in HUVEC (Western blot.
Mean ± SE, n=3; bP<0.01 vs normal).
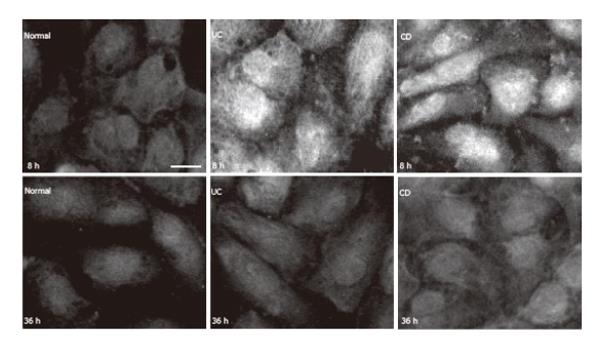
Figure 4 iNOS in HUVEC (immunoreaction was visualized by FITC.
bar: 10 µm).
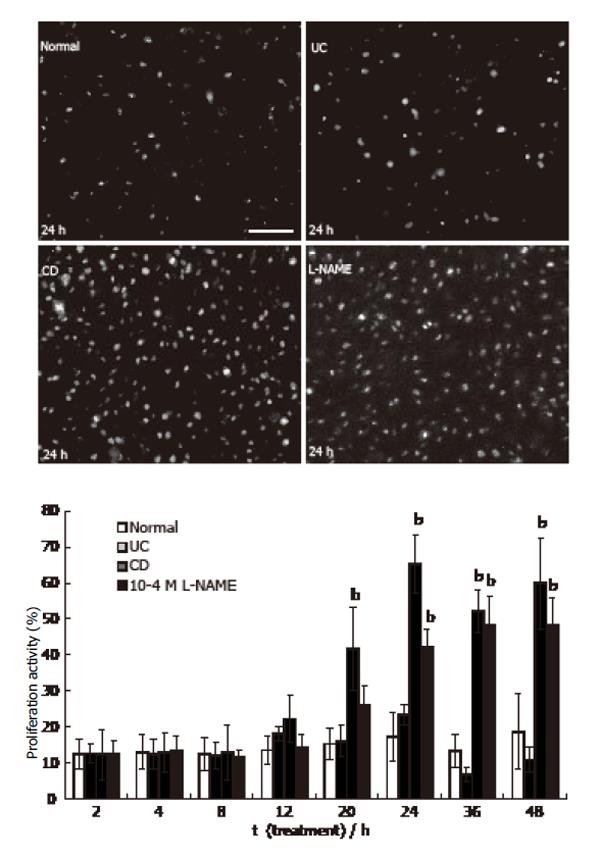
Figure 5 Proliferation activity of HUVEC (Ki-67 immunoreactivity was visualized by FITC.
bar: 50 µm. mean ± SE, n = 3; bP<0.01 vs normal).
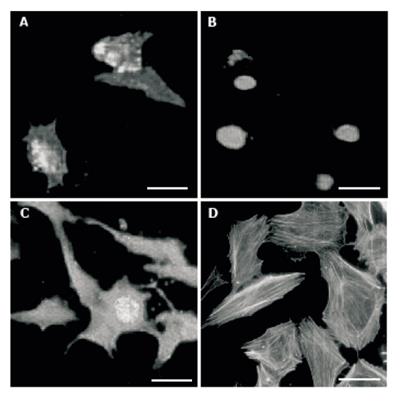
Figure 6 HUVEC viability.
A: Early apoptotic cells; B: necrotic cells; C: Late apoptotic cell; D: Phalloidin conjugated with TRITC labeled actin filaments. bars: 10 µm.
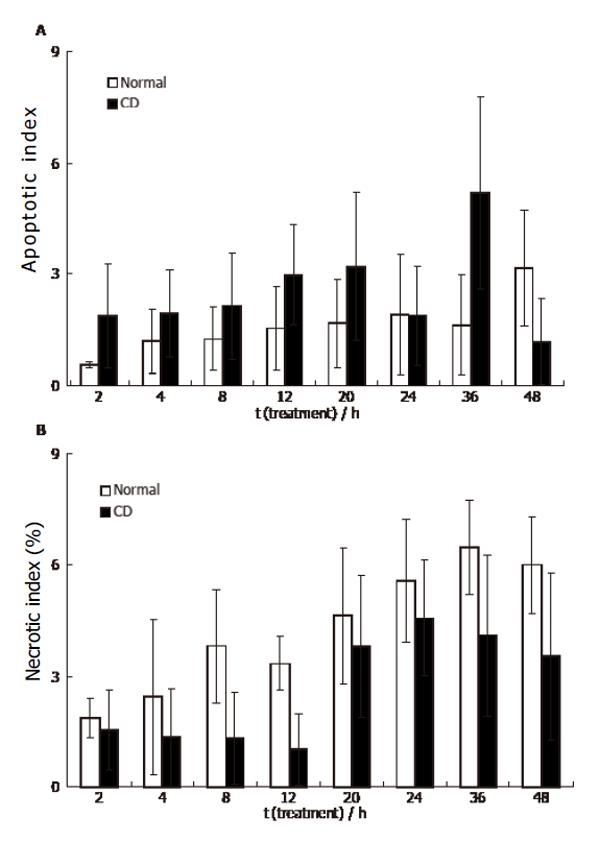
Figure 7 HUVEC 48 h incubation with CD sera (mean ± SE, n = 3).
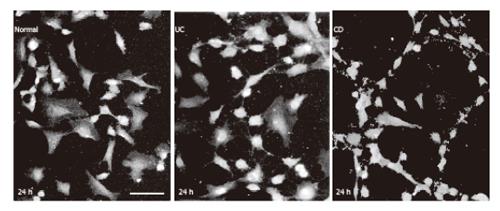
Figure 8 HUVEC visualized by eNOS immunofluorescence in culture.
bar: 50 µm.
- Citation: Palatka K, Serfőző Z, Veréb Z, Bátori R, Lontay B, Hargitay Z, Nemes Z, Udvardy M, Erdődi F, Altorjay I. Effect of IBD sera on expression of inducible and endothelial nitric oxide synthase in human umbilical vein endothelial cells. World J Gastroenterol 2006; 12(11): 1730-1738
- URL: https://www.wjgnet.com/1007-9327/full/v12/i11/1730.htm
- DOI: https://dx.doi.org/10.3748/wjg.v12.i11.1730


