Copyright
©2006 Baishideng Publishing Group Co.
World J Gastroenterol. Jan 7, 2006; 12(1): 29-35
Published online Jan 7, 2006. doi: 10.3748/wjg.v12.i1.29
Published online Jan 7, 2006. doi: 10.3748/wjg.v12.i1.29
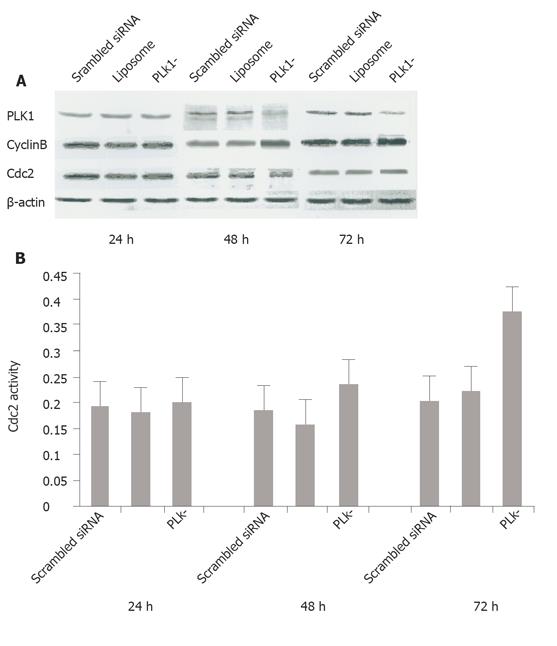
Figure 1 Effect of PLK1 depletion on members of the MPF complex.
A: Western blotting showed that PLK1 levels decreased and cyclinB level increased at 48 and 72 h after RNAi targeting PLK, whereas there was almost no change in cdc2 level at 24, 48, and 72 h. B: Cdc2 activity was substantially increased at 48 and 72 h after PLK1 expression knockdown.
Figure 2 Changes in tumor cell cycle after PLK1 depletion.
A: Fluorescence-activated cell sorting (FACS) analysis revealed that PLK– MKN45 cells had an increased G2 DNA content and were accumulated at G2/M phase. B: Cells treated with siRNA became rounder in shape.
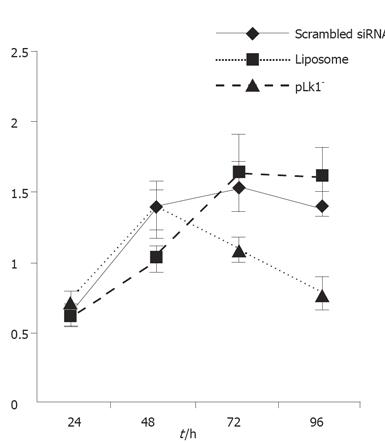
Figure 3 Effect of PLK1 depletion on cell proliferation.
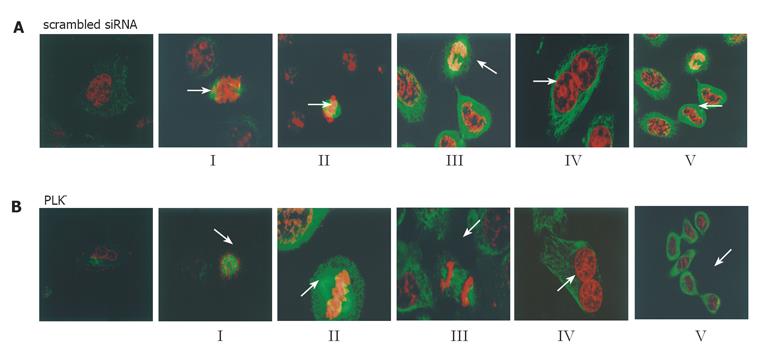
Figure 4 Tumor cell mitosis decreases following PLK1 depletion.
A: Control cells showed clear mitotic frameworks, whereas the spindles of the PLK– depleted cells were unclear and broken when the sister chromosomes were separated. B: The five examined substages of mitosis (I-V) in both control and PLK– depleted cells.
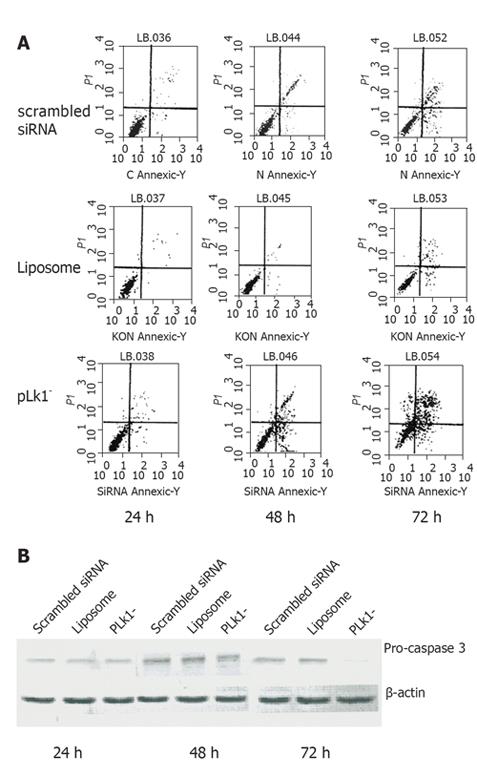
Figure 5 PLK1 siRNA induces MKN45 apoptosis.
A: Annexin V staining and FCM revealed a higher percentage of apoptotic PLK1-depleted cells at 48 and 72 h; B: Western blotting showed reduced pro-caspase 3 levels in PLK– cells at 48 and 72 h.
- Citation: Chen XH, Lan B, Qu Y, Zhang XQ, Cai Q, Liu BY, Zhu ZG. Inhibitory effect of Polo-like kinase 1 depletion on mitosis and apoptosis of gastric cancer cells. World J Gastroenterol 2006; 12(1): 29-35
- URL: https://www.wjgnet.com/1007-9327/full/v12/i1/29.htm
- DOI: https://dx.doi.org/10.3748/wjg.v12.i1.29


