Copyright
©2006 Baishideng Publishing Group Co.
World J Gastroenterol. Jan 7, 2006; 12(1): 119-122
Published online Jan 7, 2006. doi: 10.3748/wjg.v12.i1.119
Published online Jan 7, 2006. doi: 10.3748/wjg.v12.i1.119
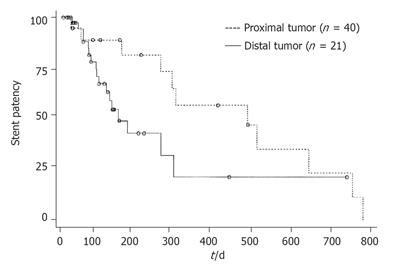
Figure 1 Kaplan-Meier graph showing cumulative stent patency.
The difference was borderline significant between the two groups.
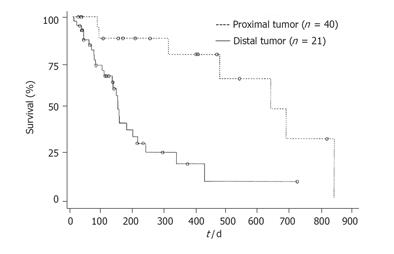
Figure 2 Kaplan-Meier graph showing survival of the patients.
There was a significant difference observed between the proximal tumor and distal tumor.
- Citation: Chen JH, Sun CK, Liao CS, Chua CS. Self-expandable metallic stents for malignant biliary obstruction: Efficacy on proximal and distal tumors. World J Gastroenterol 2006; 12(1): 119-122
- URL: https://www.wjgnet.com/1007-9327/full/v12/i1/119.htm
- DOI: https://dx.doi.org/10.3748/wjg.v12.i1.119


