Copyright
©2005 Baishideng Publishing Group Inc.
World J Gastroenterol. Mar 7, 2005; 11(9): 1356-1360
Published online Mar 7, 2005. doi: 10.3748/wjg.v11.i9.1356
Published online Mar 7, 2005. doi: 10.3748/wjg.v11.i9.1356
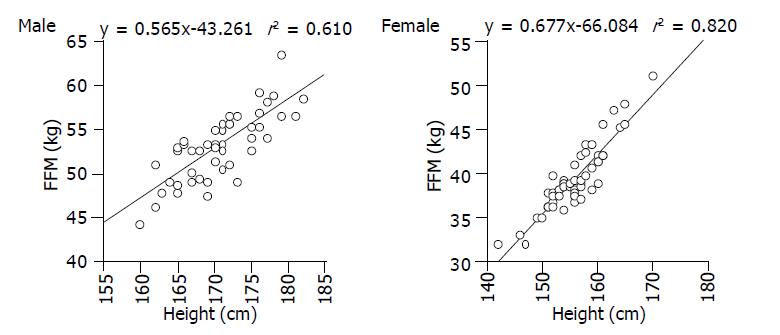
Figure 1 Correlation between fat-free mass (FFM) and height in volunteer males (right panel) and females (left panel).
There was a significant positive correlation between FFM and height in each sex (male: r = 0.781, P<0.0001; female: r = 0.906, P<0.0001).
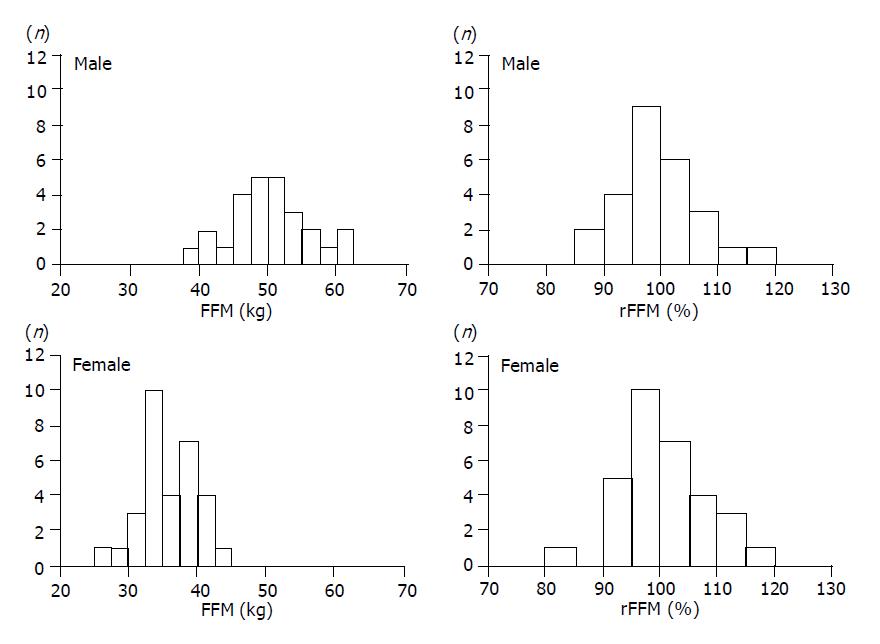
Figure 2 Distribution of fat-free mass (FFM) and relative FFM (rFFM) in cirrhotic patients.
In FFM, the distributions among the sexes differed significantly (left two columns) (P<0.001). In contrast, when rFFM was applied for the same patients (right two columns); the dispersion did not differ significantly.
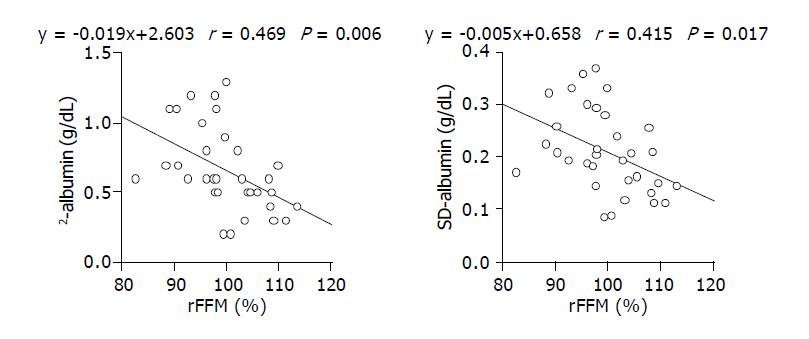
Figure 3 Correlation between rFFM with -albumin (right panel) and SD-albumin (left panel).
In patients with average ALT levels >50 U/L, there was a significant correlation of rFFM with SD-albumin (r = 0.469, P = 0.006) and with -albumin (r = 0.415, P = 0.017).
- Citation: Kotoh K, Nakamuta M, Fukushima M, Matsuzaki C, Enjoji M, Sakai H, Nawata H. High relative fat-free mass is important for maintaining serum albumin levels in patients with compensated liver cirrhosis. World J Gastroenterol 2005; 11(9): 1356-1360
- URL: https://www.wjgnet.com/1007-9327/full/v11/i9/1356.htm
- DOI: https://dx.doi.org/10.3748/wjg.v11.i9.1356


