Copyright
©2005 Baishideng Publishing Group Inc.
World J Gastroenterol. Mar 7, 2005; 11(9): 1339-1344
Published online Mar 7, 2005. doi: 10.3748/wjg.v11.i9.1339
Published online Mar 7, 2005. doi: 10.3748/wjg.v11.i9.1339
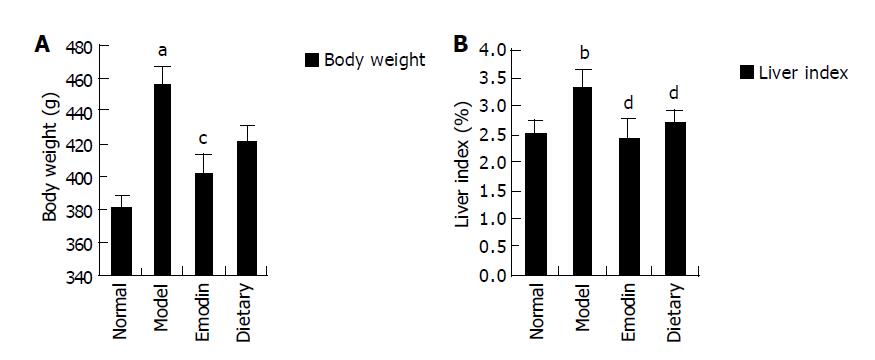
Figure 1 Body weight and liver index changes among four groups.
A: Comparison of murine body weight among relevant groups. aP<0.05 vs normal group, cP<0.05 vs model control group; B: Comparison of liver index among relevant groups. bP<0.01 vs normal group, dP<0.01 vs model control group.
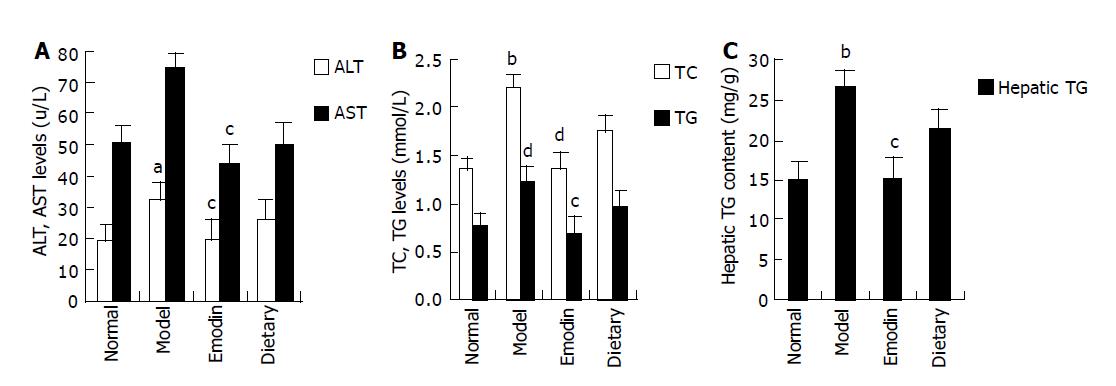
Figure 2 Hepatic enzyme activity, blood lipids levels and hepatic TG contents among four groups.
A: Comparison of serum ALT and AST activities among relevant groups. aP<0.05 vs normal group, cP<0.05 vs model control group; B: Comparison of serum TC and TG levels among relevant groups. aP<0.05 vs normal group, bP<0.01 vs normal group, cP<0.05 vs model control group, dP<0.01 vs model control group; C: Comparison of hepatic TG contents among relevant groups. bP<0.01 vs normal group, cP<0.05 vs model control group.
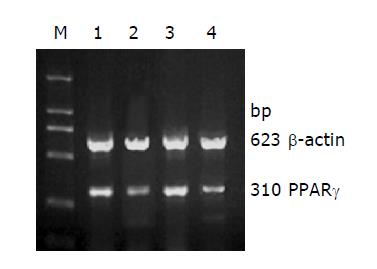
Figure 3 The expression of PPAR-gamma mRNA in murine liver tissues.
M: marker. Lane 1: normal group; lane 2: model control group; lane 3: emodin group; lane 4: dietary group.
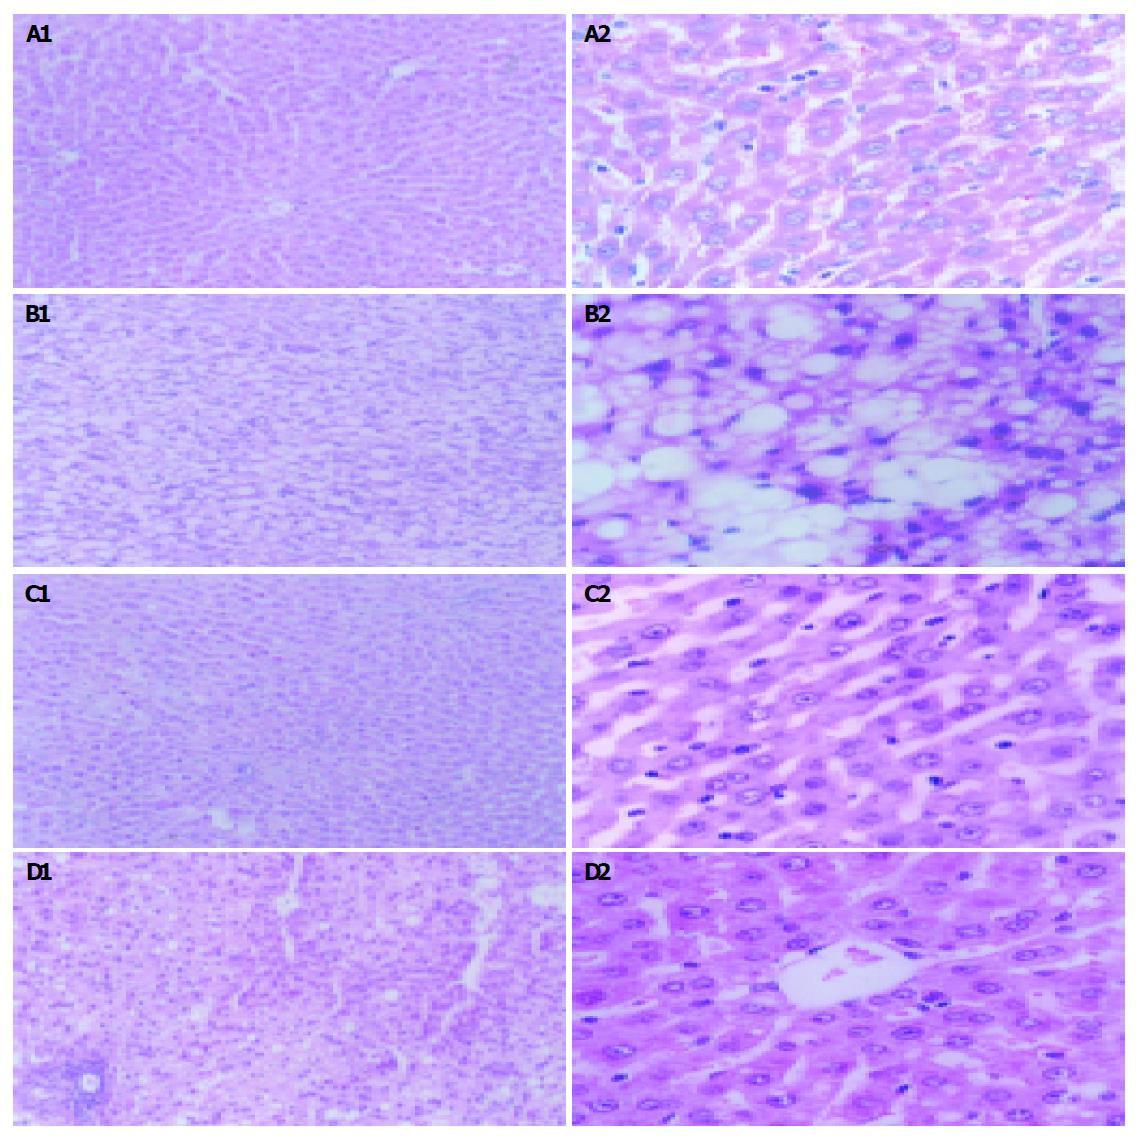
Figure 4 Hepatopathological manifestations among four groups.
A: Murine normal liver tissue stained with HE. A1: HE×100, A2: HE×400; B: Demonstration of fatty liver tissues in model control group. Moderate to severe macro vesicular steatosis, diffusely distributed throughout the liver lobule, and parenchymal inflammation with both acute and chronic inflammatory cells accompanying focal necrosis. B1: HE×100, B2: HE×400; C: Significant improvement of liver steatosis in emodin group. There was significant reduction of fatty deposits in liver tissues and the histologic figures restored to nearly normal. C1: HE×100, C2: HE×400; D: Liver steatosis in dietary group. The degree of liver steatosis was improved, but mild steatosis still existed. D1: HE×100, D2: HE×400.
- Citation: Dong H, Lu FE, Gao ZQ, Xu LJ, Wang KF, Zou X. Effects of emodin on treating murine nonalcoholic fatty liver induced by high caloric laboratory chaw. World J Gastroenterol 2005; 11(9): 1339-1344
- URL: https://www.wjgnet.com/1007-9327/full/v11/i9/1339.htm
- DOI: https://dx.doi.org/10.3748/wjg.v11.i9.1339


