Copyright
©2005 Baishideng Publishing Group Inc.
World J Gastroenterol. Feb 28, 2005; 11(8): 1210-1214
Published online Feb 28, 2005. doi: 10.3748/wjg.v11.i8.1210
Published online Feb 28, 2005. doi: 10.3748/wjg.v11.i8.1210
Figure 1 Immunohistochemical staining of MCs phenotype and TAMs A: Immunostaining for MC tryptase, ×200; B: Immunostaining for MC chymase, ×200; C: Immunostaining for macrophages (CD68), ×400.
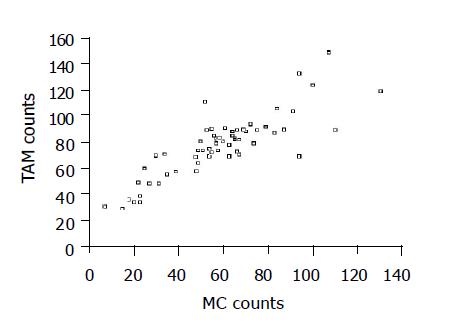
Figure 2 Correlation between MCs and TAMs.
Figure 3 Survival analysis.
A: Survival comparison between patients with a high level of MC infiltration and those with a low level of MC infiltration (Kaplan-Meier method); B: Survival comparison between patients with a high level of TAM infiltration and those with a low level of TAM infiltration (Kaplan-Meier method); C: Survival comparison between patients with a high level of both MC and TAM infiltration and those with a low level of both MC and TAM infiltration (Kaplan-Meier method).
- Citation: Tan SY, Fan Y, Luo HS, Shen ZX, Guo Y, Zhao LJ. Prognostic significance of cell infiltrations of immunosurveillance in colorectal cancer. World J Gastroenterol 2005; 11(8): 1210-1214
- URL: https://www.wjgnet.com/1007-9327/full/v11/i8/1210.htm
- DOI: https://dx.doi.org/10.3748/wjg.v11.i8.1210


