Copyright
©2005 Baishideng Publishing Group Inc.
World J Gastroenterol. Feb 28, 2005; 11(8): 1141-1148
Published online Feb 28, 2005. doi: 10.3748/wjg.v11.i8.1141
Published online Feb 28, 2005. doi: 10.3748/wjg.v11.i8.1141
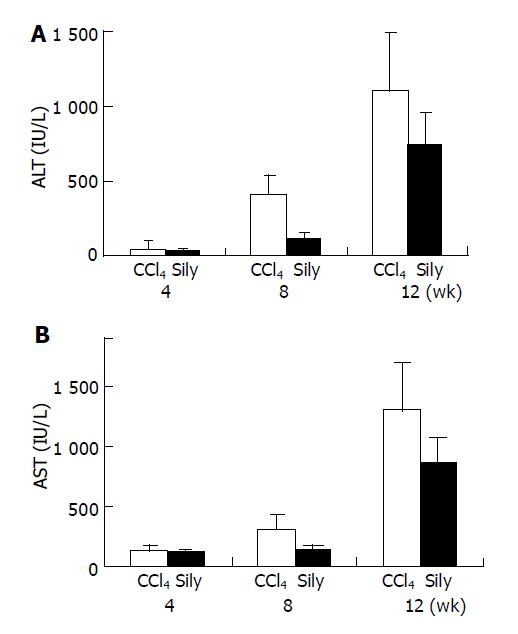
Figure 1 Serum ALT and AST levels in the CCl4- or CCl4 with silymarin-treated groups.
A: Serum ALT levels were detected at 4, 8, and 12 wk; B: Serum AST levels were detected at 4, 8, and 12 wk. In the CCl4 with silymarin-treated group (black bar), increase of serum ALT and AST levels were lower than those of CCl4-treated group (open bar).
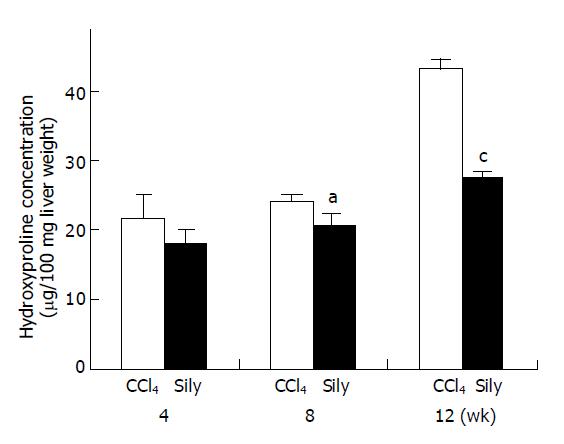
Figure 2 Hydroxyproline content determinated in the livers of CCl4- or CCl4 with silymarin-treated groups.
At 4, 8 and 12 wk, HYP contents of CCl4 with silymarin-treated group (black bar) reduced compared to those of control group (open bar). Data are expressed as the mean±SD (n = 5). aP<0.05 means significant compared to that of CCl4-treated groups. cP<0.005 means significant compared to that of CCl4-treated groups.
Figure 3 Hepatic fibrosis and accumulation of collagen in only CCl4- or CCl4 with silymarin-treated groups.
In only CCl4-treated group - A and G: At 4 wk, collagen (arrowhead) accumulation around the blood vessels; B and H: At 8 wk, collagen fiber (arrowhead) was more abundant in the centrilobular area and neighboring central veins were bridged by fibrous septa; C and I: At 12 wk, pseudolobuli were formed actively and macrovesicular lipid droplets were detected. The collagenous septa (arrowhead) were much thicker, and pseudolobuli were subdivided into smaller lobuli. In CCl4 with silymarin-treated groups - D and J: At 4 wk, connective tissue was almost normal around the areas of central veins; E and K: At 8 wk, the slight accumulation and spread of collagen fibers around central veins was observed; F and L: At 12 wk, large lipid accumulation was detected more than that of CCl4-treated group and pseudolobuli were formed by thin collagenous septa. HE stain, A-F; Azan stain, G-L. Original magnification: ×33, A-L.
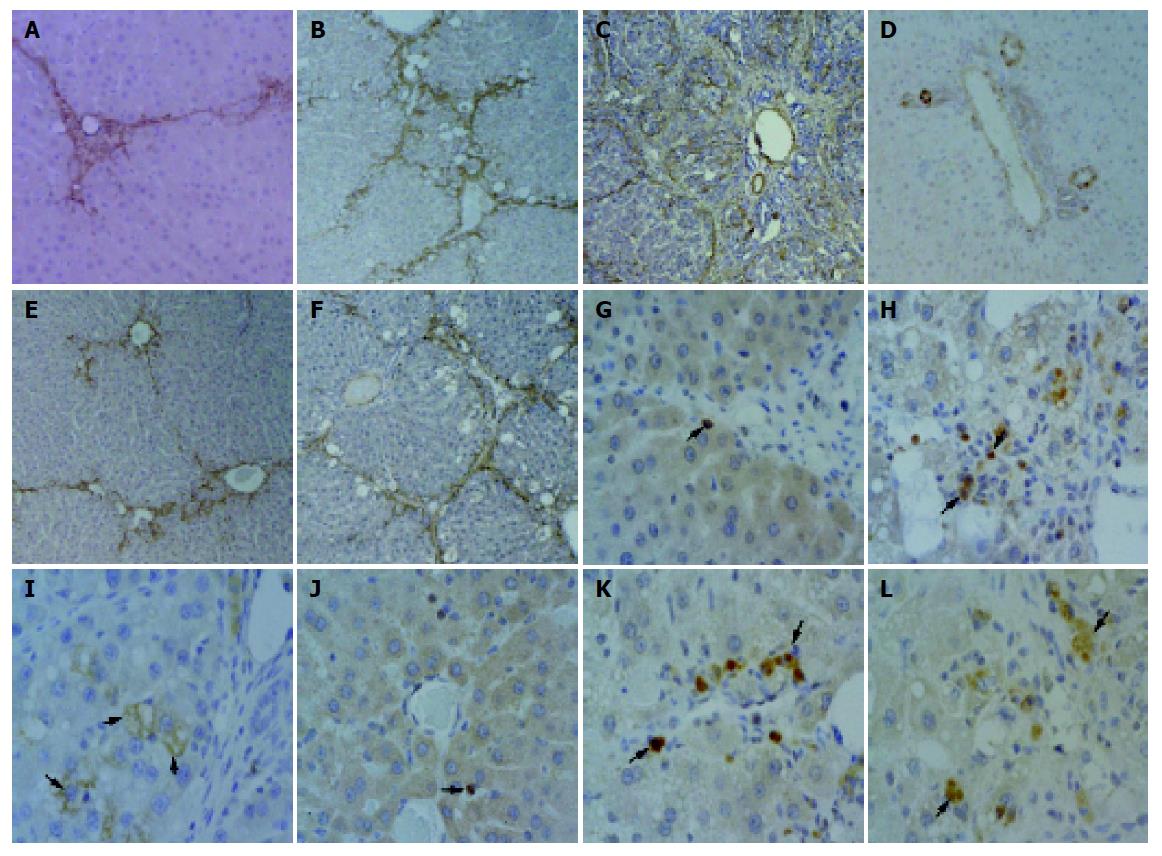
Figure 4 Positive reactive cells for α-SMA, TGF-β1 in only CCl4- or CCl4 with silymarin-treated groups.
In only CCl4-treated group - A: Weak positive reaction for α-SMA was detected at 4 wk; B: At 8 wk, increasing positive reaction for α-SMA was observed around fibrous septa; C: At 12 wk, α-SMA-positive cells observed a little decreasing along to the thick collagenous septa. In CCl4 with silymarin-treated group -D: positive reaction for α-SMA was slightly detected at 4 wk; E: At 8 wk, α-SMA-positive cells were lower than that of CCl4-only-treated group; F: At 12 wk, positive expression of α-SMA was shown the same pattern with result of CCl4-treated group at 8 wk. In only CCl4-treated group -G: Weak positive reaction for TGF-β1 (arrowhead) was detected in portal triad at wk 4; H: At 8 wk, increasing positive reaction for TGF-β1 (arrowhead) was observed in macrophage and around fibrous septa; I: At 12 wk, several hepatocytes (open arrowhead), located peripherally within pseudolobules, were observed TGFbeta1-positive immunoreaction. In CCl4 with silymarin-treated group - J: At 4 wk, positive reaction for TGF-β1 (arrowhead) was slightly detected in macrophages; K: At 8 wk, positive reactive cells for TGF-β1 (arrowhead) were lower than that of CCl4-only-treated group; L: At 12 wk, expressions of TGFbeta1 (arrowhead) were seen weaker than those of CCl4-treated group and not detected in hepatocytes. Immunostaining for α-SMA (A-F) and TGF-β1 (G-L) with hematoxylin counterstain. Original magnifications: ×33 (A-F); ×132 (G-L).
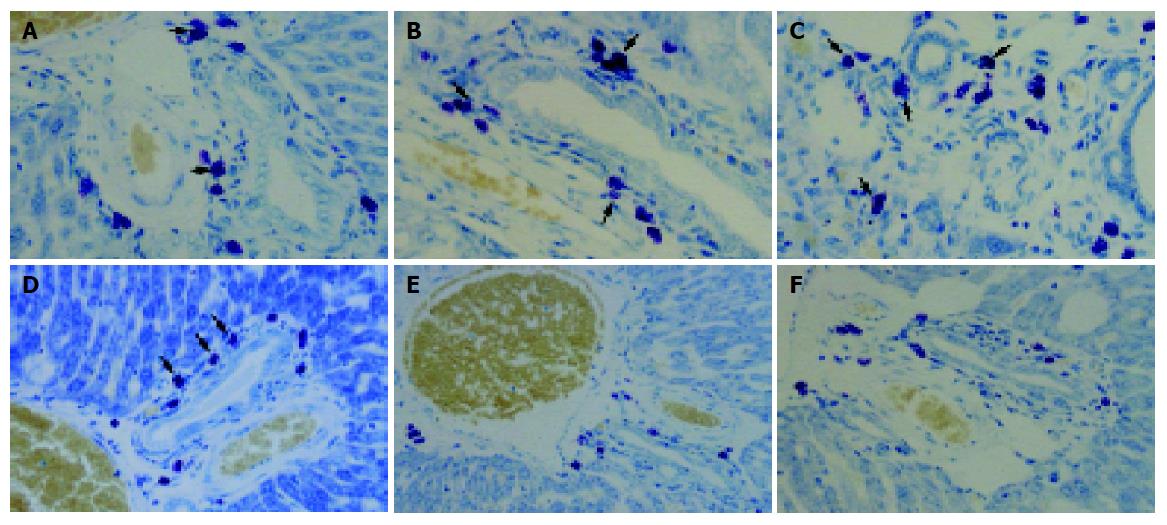
Figure 5 Toluidine blue-stained liver tissue of only CCl4- or CCl4 with silymarin-treated groups.
In only CCl4-treated group - A: At 4 wk, specific toluidine blue-stained mast cells (arrowhead) were detected in periportal region; B: At 8 wk, the number of mast cell increased; C: At 12 wk, mast cells increased along the thick collagenous septa. In CCl4 with silymarin-treated group - D: Positive reaction for toluidine blue (arrowhead) was slightly detected at 4 wk; E: At 8 wk, α-SMA-positive cells were lower than that of CCl4-only-treated group; F: At 12 wk, positive expression of α-SMA was shown in the same pattern as with the result of CCl4-treated group at 8 wk. Toluidine blue stain, A-F. Original magnification: ×132, A-F.
Figure 6 Recruitment of mast cell numbers in only CCl4- or CCl4 with silymarin-treated groups.
At 4, 8 and 12 wk, mast cell numbers of CCl4 with silymarin-treated group (black bar) significantly reduced compared to those of control group (open bar). Data are expressed as the mean±SD. aP<0.05 means significant compared to that of CCl4-treated groups. cP<0.005 smeans significant compared to that of CCl4-treated groups.
- Citation: Jeong DH, Lee GP, Jeong WI, Do SH, Yang HJ, Yuan DW, Park HY, Kim KJ, Jeong KS. Alterations of mast cells and TGF-β1 on the silymarin treatment for CCl4-induced hepatic fibrosis. World J Gastroenterol 2005; 11(8): 1141-1148
- URL: https://www.wjgnet.com/1007-9327/full/v11/i8/1141.htm
- DOI: https://dx.doi.org/10.3748/wjg.v11.i8.1141


