Copyright
©2005 Baishideng Publishing Group Inc.
World J Gastroenterol. Feb 28, 2005; 11(8): 1122-1130
Published online Feb 28, 2005. doi: 10.3748/wjg.v11.i8.1122
Published online Feb 28, 2005. doi: 10.3748/wjg.v11.i8.1122
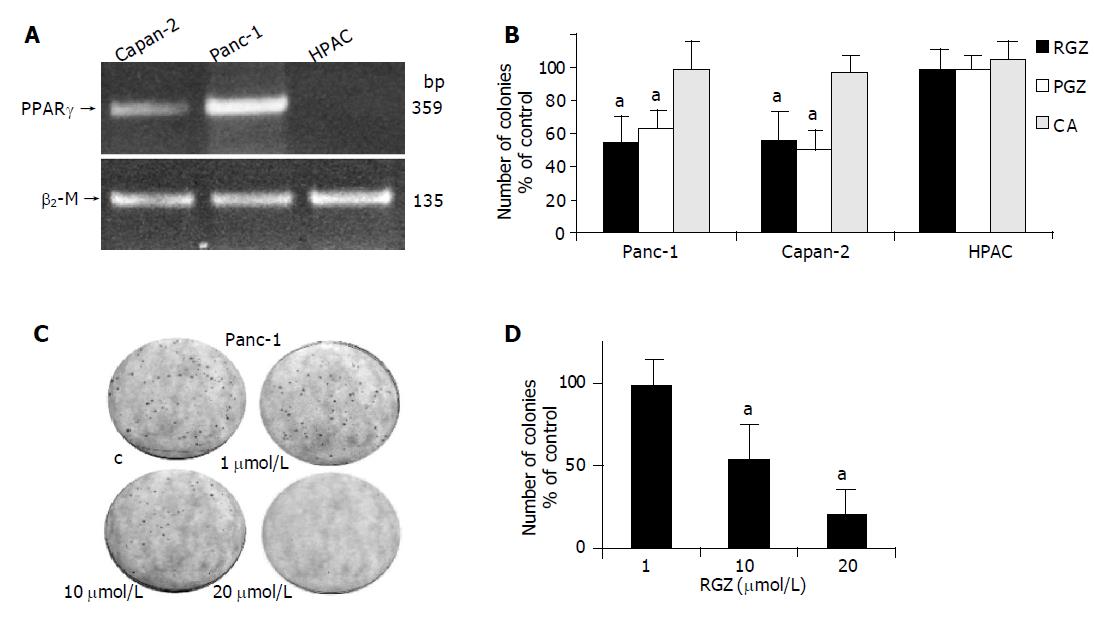
Figure 1 Effect of TZD on anchorage-independent growth in human pancreatic adenocarcinoma cells.
A: PPARγ expression in human pancreatic adenocarcinoma. One microgram of total RNA extracted from three pancreatic cancer cell lines (Capan-2, Panc-1, and HPAC) was reverse transcribed using random hexamers and amplified by polymerase chain reaction using specific primers for PPARγ and for β2-microglobulin (β2-M) as described in Methods. The reverse-transcription polymerase chain reaction products were electrophoresed on ethidium bromide-containing agarose gel; B: TZD inhibit anchorage-independent growth. 2x10⁴ cells were plated into media containing 0.3% agarose, supplemented with either 10 µmol/L of TZD (RGZ o PGZ), or 1 mmol/L clofibrate (CA). After 14 d the number of colonies was determined and then expressed as the percentage of control cells treated with vehicle (DMSO) alone. The mean±SD of six independent experiments performed for each cell line in triplicate are shown. aP<0.05 (or higher degree of significance) vs control; C: Dose-dependent inhibition of anchorage-independent growth by TZD in Panc-1 cells. Clonogenic assay of Panc-1 cells treated with the indicated concentrations of RGZ was performed as described in Methods. The number of colonies was then given as the percentage of control cells treated with vehicle alone. The mean±SD of five independent experiments performed for each in triplicate are shown. aP<0.05 (or higher degree of significance) vs control.
Figure 2 PPARγ expression and transcriptional activity in HPAC cells transduced with PPARγ-expressing retrovirus.
A: HPAC cells were stable transduced by retrovirus driving expression of human PPARγ (hPPARγ-pLNCX) as described in methods. After selection with G418 four resistant clones were expanded and screened for hPPARγ expression. The cell extracts were fractionated by sodium dodecyl sulfate-polyacrylamide gel electrophoresis and blotted to nitrocellulose. The proteins (40 μg) were detected with antibody raised against human PPARγ. P1-P4 represent nuclear protein extracted from G418-resistant HPAC cell clones; M represents nuclear proteins from mock (pLNCX) transduced HPAC cells; W (wild type) represents nuclear proteins from untransduced, parental HPAC cells; B: After overnight attachment cells were transfected with ARE-73-tk-luciferase reporter plasmid and pSV2-CAT as internal control for transfection efficiency. Twenty-four hours after transfection cells were treated with RGZ at the indicated concentration. Twenty-four hours after treatment the cells were harvested for luciferase and CAT assay as described in Methods. The data is expressed as mean±SD for 4 replicate experiments performed in triplicate; aP<0.05 vs control; C: Effect of TDZ treatment on anchorage-independent growth of HPAC cells transduced with PPARγ-expressing retrovirus. Clonogenic assay of P3-HPAC cells treated with the indicated concentration of RGZ was performed as described in materials and methods. The number of colonies was then given as the percentage of control cells treated with vehicle alone. The mean±SD of five independent experiments performed for each in triplicate are shown. aP<0.05 vs Mock transduced cells.
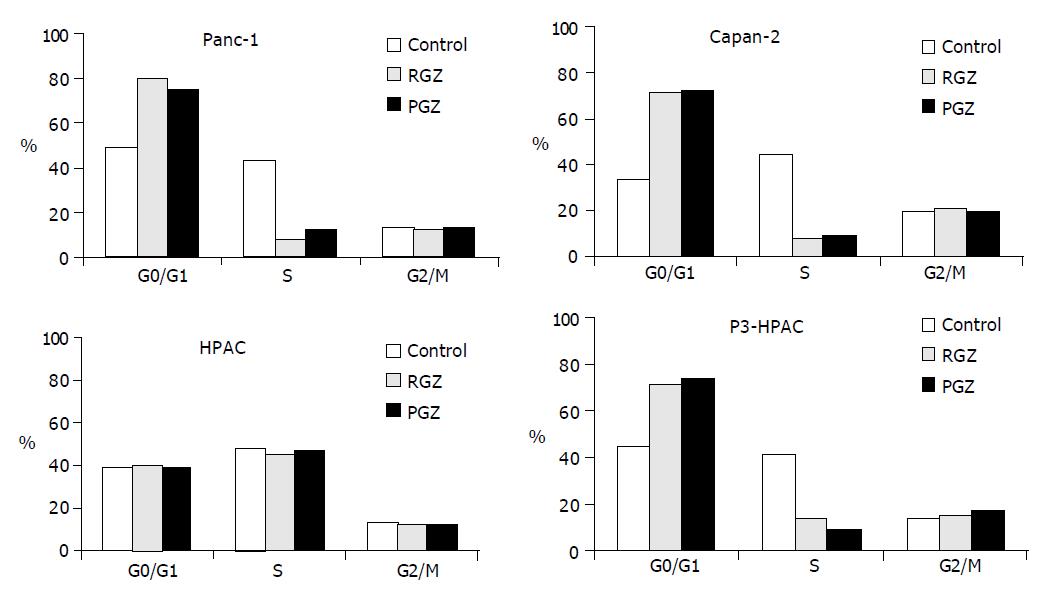
Figure 3 Cell cycle phase distribution of pancreatic tumor cells treated with TZD.
After overnight attachment cells were treated with 20 μmol/L of TZD (RGZ or PGZ) for 72 h, followed by staining with propidium iodide and flow cytometric analysis of DNA content. The percentage of cells in each cell cycle phase was determined by analysis of the DNA content histograms using Modfit software as described in Methods. Data show the percentage of cells in each phase of cell cycle in a representative experiment. Similar results were obtained in at least three independent experiments.
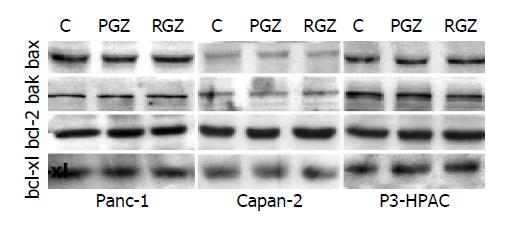
Figure 4 Expression of apoptotic proteins in cells treated with TZD.
Sub-confluent cells were treated with 20 μmol/L of TZD (RGZ or PGZ) for 24 h. Cells were then harvested, and whole-cell protein extracts were fractionated by sodium dodecyl sulfate-polyacrylamide electrophoresis and transferred to nitrocellulose paper as described in Methods. Different proteins were detected by incubating the filter with specific antibodies.
Figure 5 TZD-induced ductal differentiation in pancreatic adenocarcinoma cells.
A: Effect of RGZ on the expression of differentiation markers in Panc-1 cells. After 24 h of plating, cells were incubated with 20 μmol/L of RGZ for the indicated time intervals. Protein extracts were then extracted and separated by Western blotting as described in Methods. Immunoreactive proteins were detected by incubating the filters with the specific primary antibodies. A representative of three independent experiments, yielding similar results, is shown; B: Effect of RGZ on tumor cells morphology. Panc-1 cells were plated onto sterile culture chambers and then treated with 20 μmol/L of RGZ for 96 h. After the incubation period cells were photographed with Axiovert 200 Image System (Zeiss, Gottingen, Germany). Original magnification ×200.
Figure 6 Effect of TZD on expression of differentiation markers in HPAC cells transduced with PPARγ-expressing retrovirus.
Untransduced parental HPAC cells. A: or PPARγ-overexpressing P3-HPAC cells; B: were incubated with 20 μmol/L of RGZ for the indicated time intervals. Protein extracts were then extracted and separated by Western blotting as described in Methods. Immunoreactive proteins were detected by incubating the filters with the specific primary antibodies. A representative of three independent experiments, yielding similar results, is shown.
- Citation: Ceni E, Mello T, Tarocchi M, Crabb DW, Caldini A, Invernizzi P, Surrenti C, Milani S, Galli A. Antidiabetic thiazolidinediones induce ductal differentiation but not apoptosis in pancreatic cancer cells. World J Gastroenterol 2005; 11(8): 1122-1130
- URL: https://www.wjgnet.com/1007-9327/full/v11/i8/1122.htm
- DOI: https://dx.doi.org/10.3748/wjg.v11.i8.1122


