Copyright
©2005 Baishideng Publishing Group Inc.
World J Gastroenterol. Dec 28, 2005; 11(48): 7579-7584
Published online Dec 28, 2005. doi: 10.3748/wjg.v11.i48.7579
Published online Dec 28, 2005. doi: 10.3748/wjg.v11.i48.7579
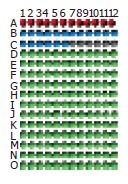
Figure 1 Arrangement of all spots on gene chip.
Positive controls, negative controls, empty controls, HCV probes.
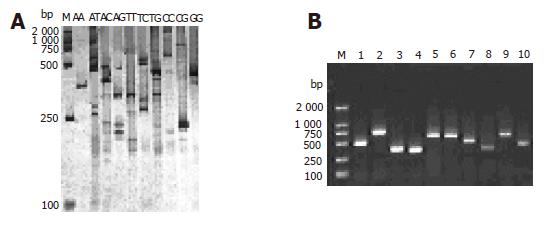
Figure 2 RD-PCR patterns of HCV genes (A) and 1.
5% agarose gel electrophoresis of RD-PCR products from the white clones of HCV genomic fragments (B). M: MDL2 000 standard DNA ladder; lanes 1-10: PCR products of positive clones.
Figure 3 Scanning plots of hybridizing signals on gene chip of HCV (A) and modified gene chip (B).
The samples were serially diluted (1.02×10⁵, 1.01×10⁸, 1.04×10¹¹ copies/mL) and used in microarray analysis.
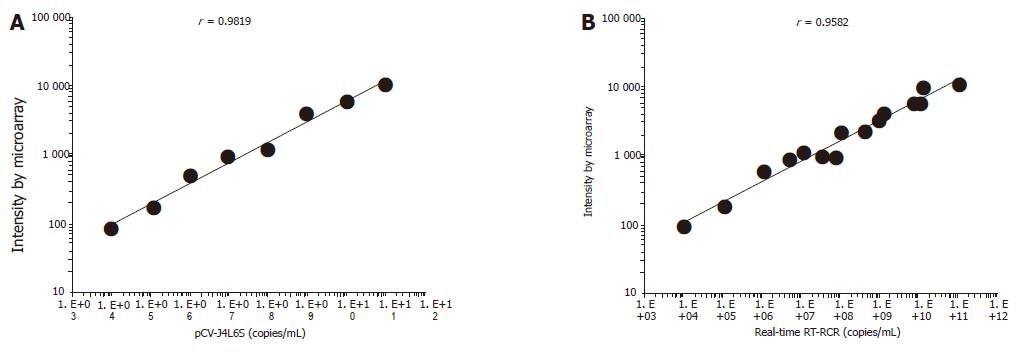
Figure 4 Fluorescence intensity from cDNA microarray analysis as a function of serial dilution from 104 to 1011 copies of plasmid pCV-J4L6S (r = 0.
9819, bP<0.01)/mL (A) and comparison of the HCV RNA levels in 15 serum samples determined by cDNA microarray analysis and RT-PCR (Taqman) assays (B).
- Citation: Sun ZH, Ma WL, Zhang B, Peng YF, Zheng WL. Application of restriction display PCR technique in the preparation of cDNA microarray probes. World J Gastroenterol 2005; 11(48): 7579-7584
- URL: https://www.wjgnet.com/1007-9327/full/v11/i48/7579.htm
- DOI: https://dx.doi.org/10.3748/wjg.v11.i48.7579


