Copyright
©2005 Baishideng Publishing Group Inc.
World J Gastroenterol. Dec 21, 2005; 11(47): 7466-7472
Published online Dec 21, 2005. doi: 10.3748/wjg.v11.i47.7466
Published online Dec 21, 2005. doi: 10.3748/wjg.v11.i47.7466
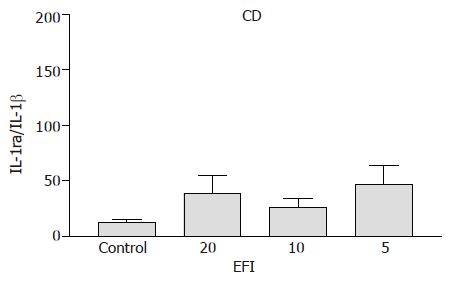
Figure 1 IL-1ra/IL-1β ratio in CD patients after incubation with elemental diet fish oil (EFI).
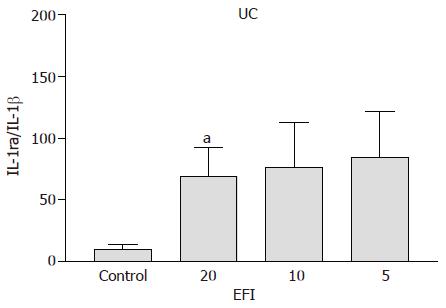
Figure 2 IL-1ra/IL-1β ratio in UC patients after incubation with elemental diet fish oil (EFI).
aP<0.05 vs control; P = 0.05 (1:10 dilutions of EFI); P<0.02 (1:5 dilutions of EFI).
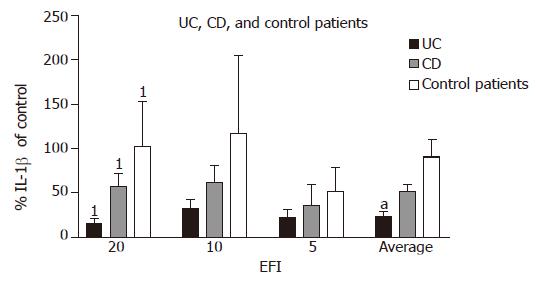
Figure 3 Percentage production of IL-1β of medium control in UC, CD, and non-inflamed non-IBD patients after incubation with EFI.
1P = 0.02, UC vs CD and UC vs control patients (1:20 dilution of EFI); aP<0.05, UC vs CD (average of all dilutions).
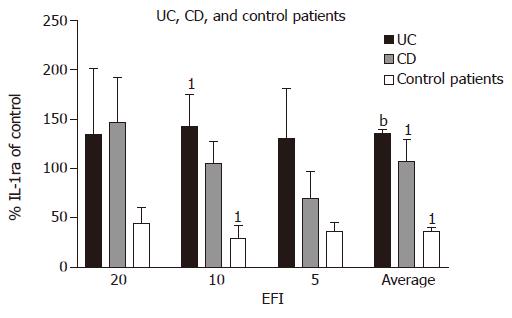
Figure 4 Percentage production IL-1ra of medium control in UC, CD, and controls (non-inflamed non-IBD patients) after incubation with EFI.
1P = 0.03, CD vs control patients (1:10) and CD vs control patients (average of three dilutions); bP<0.0001, UC vs control patients (average of all dilutions).
- Citation: Meister D, Ghosh S. Effect of fish oil enriched enteral diet on inflammatory bowel disease tissues in organ culture: Differential effects on ulcerative colitis and Crohn’s disease. World J Gastroenterol 2005; 11(47): 7466-7472
- URL: https://www.wjgnet.com/1007-9327/full/v11/i47/7466.htm
- DOI: https://dx.doi.org/10.3748/wjg.v11.i47.7466


